Bars, Hotels and Restaurants Become the Economy’s Fastest-Growing Employers
Hospitality companies revive their hiring after pandemic cuts, offsetting slower growth in tech jobs
Operators of hotels, bars and restaurants—hit hard as the Covid-19 pandemic took hold—are now among the country’s fastest-growing employers, offsetting a slowdown in tech-related hiring.
The leisure-and-hospitality industry is rebuilding its workforce after cutting back during the pandemic’s early days. In contrast, companies focused on providing business and tech-related services have slowed their growth in recent months.
Because the hospitality industry includes a larger number of private-sector jobs than the tech and information sectors, the shift in hiring patterns has helped keep the U.S. unemployment rate at a 53-year low and the overall job market tight.
Here is a look at how hiring patterns have shifted in recent years.
Since November, about half of job-cut announcements among U.S.-based employers have come from tech companies, according to outplacement firm Challenger, Gray & Christmas.
The cuts partially reverse some of the hiring made during the height of the pandemic, when lockdowns led to increased demand for tech products and services.
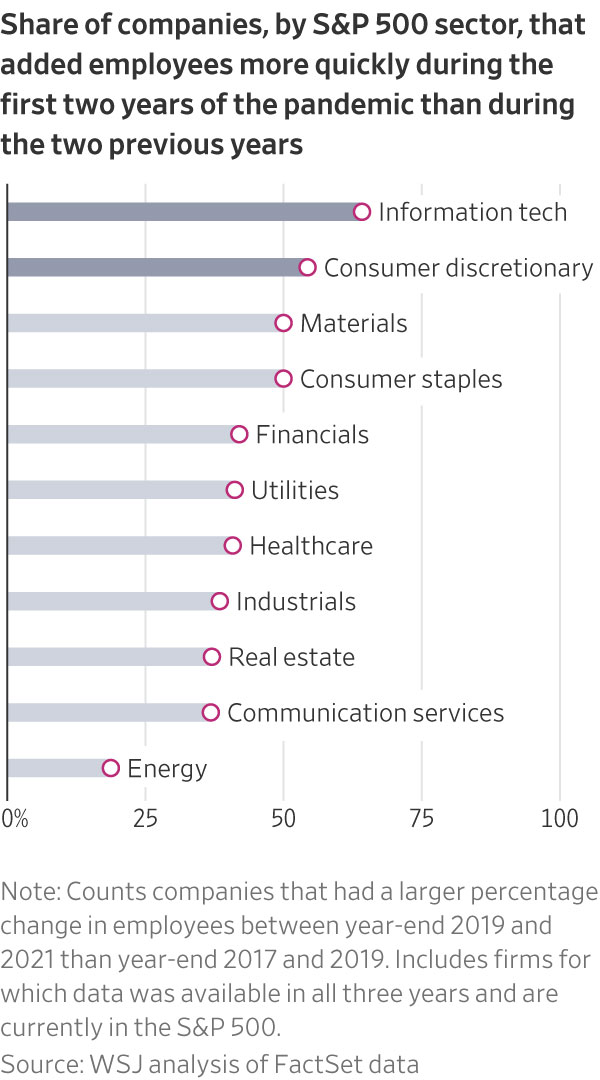
Payrolls grew faster at most companies in the S&P 500’s technology and consumer-discretionary sectors during the first two years of the pandemic than during the preceding two-year period, according to a Wall Street Journal analysis of FactSet data.

Factors such as a return to prepandemic consumer habits, rising interest rates and fears of an economic downturn have prompted some companies to recalibrate their head counts.
Amazon.com Inc., for example, nearly doubled its workforce amid increased demand for its e-commerce, grocery and cloud-computing businesses. The company grew to more than 1.5 million employees at the end of last year from about 800,000 at the end of 2019, FactSet data show. Amazon recently announced layoffs totalling more than 18,000 staffers.

The tech layoffs might not be affecting the broader employment data for other reasons. Job-cut announcements don’t always shrink company workforces as much as promised. Business can improve, vacant jobs can go unfilled and layoffs can sometimes take months to execute.
Hiring also remains strong among some of the country’s biggest companies. Chipotle Mexican Grill Inc. said in January that the restaurant chain plans to hire 15,000 workers in the U.S. ahead of an expected increase in demand. Some food businesses—such as Kroger Co., the largest U.S. supermarket operator by sales—are recruiting former employees to fill staffing gaps.
 Copyright 2020, Dow Jones & Company, Inc. All Rights Reserved Worldwide. LEARN MORE
This stylish family home combines a classic palette and finishes with a flexible floorplan
Just 55 minutes from Sydney, make this your creative getaway located in the majestic Hawkesbury region.
Continued stagflation and cost of living pressures are causing couples to think twice about starting a family, new data has revealed, with long term impacts expected
Australia is in the midst of a ‘baby recession’ with preliminary estimates showing the number of births in 2023 fell by more than four percent to the lowest level since 2006, according to KPMG. The consultancy firm says this reflects the impact of cost-of-living pressures on the feasibility of younger Australians starting a family.
KPMG estimates that 289,100 babies were born in 2023. This compares to 300,684 babies in 2022 and 309,996 in 2021, according to the Australian Bureau of Statistics (ABS). KPMG urban economist Terry Rawnsley said weak economic growth often leads to a reduced number of births. In 2023, ABS data shows gross domestic product (GDP) fell to 1.5 percent. Despite the population growing by 2.5 percent in 2023, GDP on a per capita basis went into negative territory, down one percent over the 12 months.
“Birth rates provide insight into long-term population growth as well as the current confidence of Australian families,” said Mr Rawnsley. “We haven’t seen such a sharp drop in births in Australia since the period of economic stagflation in the 1970s, which coincided with the initial widespread adoption of the contraceptive pill.”
Mr Rawnsley said many Australian couples delayed starting a family while the pandemic played out in 2020. The number of births fell from 305,832 in 2019 to 294,369 in 2020. Then in 2021, strong employment and vast amounts of stimulus money, along with high household savings due to lockdowns, gave couples better financial means to have a baby. This led to a rebound in births.
However, the re-opening of the global economy in 2022 led to soaring inflation. By the start of 2023, the Australian consumer price index (CPI) had risen to its highest level since 1990 at 7.8 percent per annum. By that stage, the Reserve Bank had already commenced an aggressive rate-hiking strategy to fight inflation and had raised the cash rate every month between May and December 2022.
Five more rate hikes during 2023 put further pressure on couples with mortgages and put the brakes on family formation. “This combination of the pandemic and rapid economic changes explains the spike and subsequent sharp decline in birth rates we have observed over the past four years,” Mr Rawnsley said.
The impact of high costs of living on couples’ decision to have a baby is highlighted in births data for the capital cities. KPMG estimates there were 60,860 births in Sydney in 2023, down 8.6 percent from 2019. There were 56,270 births in Melbourne, down 7.3 percent. In Perth, there were 25,020 births, down 6 percent, while in Brisbane there were 30,250 births, down 4.3 percent. Canberra was the only capital city where there was no fall in the number of births in 2023 compared to 2019.
“CPI growth in Canberra has been slightly subdued compared to that in other major cities, and the economic outlook has remained strong,” Mr Rawnsley said. “This means families have not been hurting as much as those in other capital cities, and in turn, we’ve seen a stabilisation of births in the ACT.”
This stylish family home combines a classic palette and finishes with a flexible floorplan
Just 55 minutes from Sydney, make this your creative getaway located in the majestic Hawkesbury region.


