Big Tech Stops Doing Stupid Stuff
This year it might be smart to invest in companies that think a little smaller

 3 min
3 min Jeff Bezos, Wally Funk, Oliver Daemen, and Mark Bezos walk near the booster to pose for a picture after flying into space in the Blue Origin New Shepard rocket on July 20, 2021 in Van Horn, Texas. Mr. Bezos and the crew were the first human spaceflight for the company. (Photo by Joe Raedle/Getty Images)")
The era of moonshots is (mostly) over. This year tech companies are taking a more earthly approach.
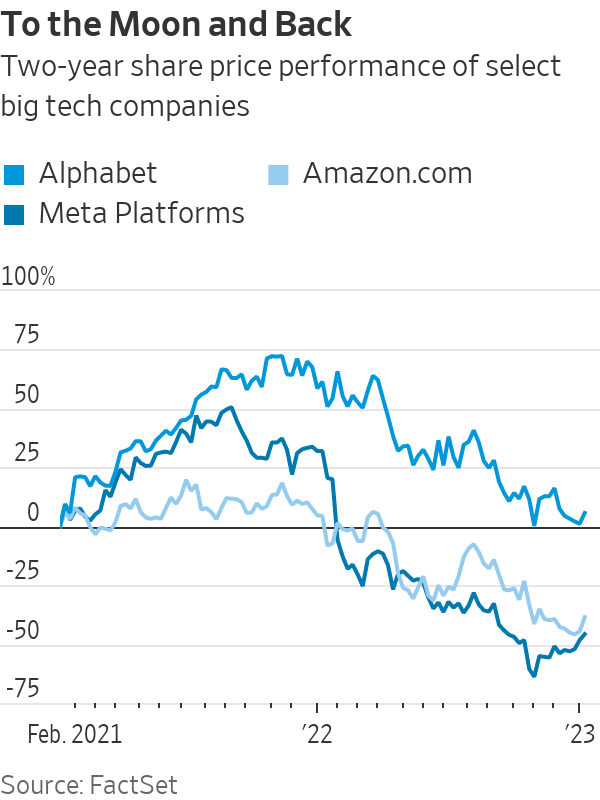
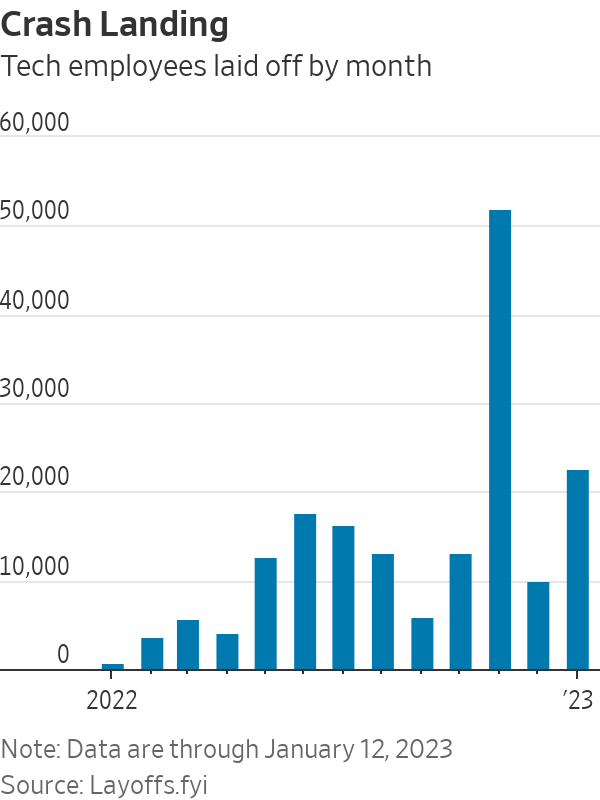
Stock charts both explain the change in boardroom sentiment and tell the story following an epic Covid-fuelled rise and fall. The tech-heavy Nasdaq fell 33% last year—its worst performance since 2008. Big tech, which spent the past several years spending on big dreams, is starting to think smaller. Last year more than 1,000 tech companies laid off employees, resulting in over 150,000 lost jobs, a tally by layoffs.fyi shows. It is an eye- popping number that could actually get worse: More than 23,000 tech workers have already been let go this year as of Jan. 13, the same tracker shows.
Many of these workers were newly hired under the mistaken assumption that booming pandemic demand would become the new normal. But a good percentage were legacy employees working on projects that, given today’s market environment, range from fiscally irresponsible to projects that fall well outside their parent company’s wheelhouse.
Meta Platforms and Amazon.com are the most high-profile examples, having cut a combined 29,000 workers so far. Meta is still reeling from an online advertising slump and the many billions of dollars that Chief Executive Officer Mark Zuckerberg is throwing at a new virtual world dubbed the metaverse. Amazon is coping with a retail slowdown in part by scaling back spending in unprofitable business areas such as its Alexa-controlled electronics products.
Meta Chief Technology Officer Andrew Bosworth said in an internal memo late last year that his company had “solved too many problems by adding headcount,” according to a recent newsletter published by the Verge. He reportedly added that headcount comes with overhead, which “makes everything slower.”
Despite its much-touted virtual ambitions, Meta said in a blog post last month that it is still devoting 80% of its total investment dollars to improving its own legacy business. In the Verge’s recent interview, Mr. Bosworth acknowledged that Meta is “changing our investment strategy” to the extent that some projects have to demonstrate value sooner to justify their high burn.
The ax also seems to be falling at the original moonshot factory: The Wall Street Journal reported that Google-parent Alphabet is laying off more than 200 employees at its Verily Life Sciences unit, plus another 40 at its robotics software company, Intrinsic. Both are part of Alphabet’s Other Bets segment, which racked up $5.9 billion in operating losses over the past four quarters while generating barely $1 billion in revenue.
Those cuts are unlikely to be the last at the Google parent, which added more than 30,000 new employees in the first nine months of 2022, even as its own advertising business started slowing.
Smaller tech companies are feeling the burn too. Redfin CEO Glenn Kelman told the Journal recently that if he could jump back in time 18 months, he would advise companies looking for profits to just “stop doing stupid stuff.”
He speaks from experience: The real-estate brokerage laid off 13% of its staff and shut down its automated home-flipping business late last year after deeming the operation too risky and expensive to continue. That followed a second quarter in which its so-called iBuying business had swelled to account for over 40% of its overall revenue. Channeling an old playbook for the new year, Mr. Kelman said in his company’s third-quarter report that Redfin “will have more cash and sell more properties” by focusing on its online audience and on better brokerage services.
Competitor Zillow gave up on its own iBuying business a year earlier than Redfin for similar reasons. It has since refocused on finding better ways to help its customers buy and sell other people’s homes. It is now using artificial intelligence to do such things as helping apartment hunters view available listings on New York City buildings they pass by and helping sellers generate floor plans for online listings based on photos. Zillow is also bundling its technology into an updated product to bolster traditional agents’ businesses.
A sector that has long worked to disrupt is now focusing on enhancing what already exists. In ride-share, Uber Technologies has now added taxi bookings to its platform in many cities, essentially feeding business to a competitor (but not without taking a small cut, of course). In Britain, Uber users can also book trains, buses and rental cars through its app. With Uber Explore, users across several cities can even book restaurant reservations and experiences.
Reinventing the wheel is so last year. The best tech investments of 2023 might be companies content to spend their coin greasing it.
 Copyright 2020, Dow Jones & Company, Inc. All Rights Reserved Worldwide. LEARN MORE


A record-breaking $11 million sale at The Centennial Collection has set a new benchmark for luxury apartment living in Bondi Junction.

As interest rates, inflation and market sentiment fluctuate, investors are being urged to focus on data, not panic.


The federal budget has rattled property investors. But the biggest mistake isn’t the tax changes, it’s the conclusion many are drawing from them.
2 min
The recent budget has forced a reckoning for property investors.
Negative gearing now restricted to new residential builds, the CGT discount gone and on paper, the numbers look different.
And many investors are responding by pivoting toward yield, prioritising cash flow over capital growth in a way that property strategists say misses the point entirely.
“The debate has shifted to yield versus growth as if they are opposing forces,” says Abdullah Nouh, founder of Melbourne-based buyers’ agency Mecca Property Group. “But that framing is itself the mistake.”
Nouh, who works with high-net-worth families and investors on long-term acquisition strategy, argues that capital growth remains the primary driver of genuine wealth creation and that the post-budget environment has made quality assets more important, not less.
The numbers make his case plainly. An additional $500 per week in rental income is welcome. A prestige asset appreciating by $1 million over a market cycle is transformative.
These are not equivalent outcomes, and portfolios built around yield at the expense of location and land value tend to generate income while wealth stands largely still.
The more nuanced shift Nouh is seeing among sophisticated investors is a move toward assets where both outcomes can be engineered simultaneously – established homes on substantial land in quality locations, where the existing dwelling can be repositioned, rental returns improved, and the underlying land value compounds independent of what sits on it.
For investors with existing equity, commercial property is also entering the conversation in a more serious way.
Prestige industrial assets, medical centres and long-leased essential retail offer income profiles that residential property in most capital city markets cannot currently match: longer lease terms, tenants covering outgoings, and greater predictability than the residential tenancy cycle.
“The investors who build lasting wealth are rarely the ones who chased yield or growth exclusively,” says Nouh.
“They are the ones who built a strategy they could sustain – one that generated enough income to hold quality assets through multiple cycles while those assets compounded in value.”
The budget has changed the settings. It has not changed the fundamentals.

As housing drives wealth and policy debate, the real risk is an economy hooked on growth without productivity to sustain it.

As the season turns, Handpicked Wines’ latest Pinot Noir and Chardonnay releases reveal how subtle shifts in place shape what ends up in the glass.