Bond Yields End Higher After Wild Session, Lifted By Inflation Data
Higher Treasury yields reflect bets that the inflation report will lead the Fed to raise interest rates more than previously anticipated

 3 min
3 min
A wild day of bond-market swings left Treasury yields higher Thursday, reflecting investors’ bets that the latest hot inflation report would push the Federal Reserve to raise interest rates more than previously anticipated.
Yields, which rise when bond prices fall, initially surged toward new multiyear highs after the inflation data, threatening a dramatic break from their recent trading range. Bonds rallied with stocks later in the session, eroding some of the climb. But, unlike stocks, they failed to recoup all of their price declines.
As has often happened this year, yields rose most sharply on short-term bonds, which are particularly sensitive to the near-term interest-rate outlook. But they also climbed on longer-term Treasurys, which tend to have a larger impact on the financial markets and the economy.
Taken together, Thursday’s moves in stocks, bonds and currencies were difficult to understand, said Zach Griffiths, a senior strategist at the research firm CreditSights. They provided more evidence, he added, of “just how volatile markets are and how difficult [they are] to navigate.”
Still, he said, Treasury yields, on their own, did tell a coherent story—with rising short-term yields driven by bets on higher rates and the less-rapid increase in longer-term yields reflecting a “recognition that recession risks are rising.”
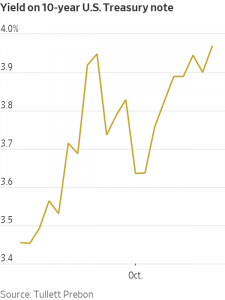
At one point Thursday, the yield on the benchmark 10-year Treasury note reached as high as 4.073%—on track for its first close at 4% or higher since 2008, according to Tradeweb. It eventually settled at 3.952%, still up from 3.901% Wednesday and around 3.85% Thursday morning just before the Labor Department released its latest consumer-price index data.
Once again, that data was disappointing to investors. Coming into Thursday, investors had hoped to see a cooling in so-called core inflation, which excludes volatile food and energy categories. Instead, those prices rose 0.6% in September from the previous month—above the forecast of economists surveyed by The Wall Street Journal, who had expected a gain of 0.4%.
Treasury yields are largely determined by what investors expect interest rates set by the Fed will be over the life of a bond. They, in turn, set a floor on borrowing costs across the economy, with rising yields pushing up rates on everything from mortgages to corporate bonds.
Interest-rate derivatives on Thursday showed that investors have essentially no doubt that the Fed will raise rates by at least another 0.75 percentage point at its next meeting in early November. They also showed the chances of a 0.75 percentage point increase in December rising to about 60% to 70% from less than 35% on Wednesday.
The inflation report caught bond investors at a vulnerable moment. Hammered all year by domestic inflation and the Fed’s response, Treasurys have encountered new threats in recent weeks from overseas developments. In particular, they were hurt by volatility in the U.K. bond market stemming from investors’ concerns about recently released tax-cut plans in that country.
They have also been generally weighed down by actions taken by global central banks to both fight inflation and support their local currencies. Many central banks have aggressively raised interest rates. Some in Asia have also intervened in foreign-exchange markets, raising concerns among investors that they might be selling U.S. Treasurys in the process.
Complicating matters on Thursday, Treasurys got some support from overseas events. Most notably, U.K. bonds staged a major rally in response to speculation that the U.K. government might reverse some of its new budget policies. That, analysts said, helped drag down Treasury yields overnight and mitigated their climb after the inflation data.
The 10-year yield has briefly inched above 4% in a couple of overnight trading sessions in recent weeks. But it has yet to settle above that threshold.
The yield has climbed from 1.496% at the end of last year and 3.131% at the end of August, contributing to deeply negative returns for investors across a range of asset classes.
 Copyright 2020, Dow Jones & Company, Inc. All Rights Reserved Worldwide. LEARN MORE


This stylish family home combines a classic palette and finishes with a flexible floorplan

Just 55 minutes from Sydney, make this your creative getaway located in the majestic Hawkesbury region.


Continued stagflation and cost of living pressures are causing couples to think twice about starting a family, new data has revealed, with long term impacts expected
2 min
Australia is in the midst of a ‘baby recession’ with preliminary estimates showing the number of births in 2023 fell by more than four percent to the lowest level since 2006, according to KPMG. The consultancy firm says this reflects the impact of cost-of-living pressures on the feasibility of younger Australians starting a family.
KPMG estimates that 289,100 babies were born in 2023. This compares to 300,684 babies in 2022 and 309,996 in 2021, according to the Australian Bureau of Statistics (ABS). KPMG urban economist Terry Rawnsley said weak economic growth often leads to a reduced number of births. In 2023, ABS data shows gross domestic product (GDP) fell to 1.5 percent. Despite the population growing by 2.5 percent in 2023, GDP on a per capita basis went into negative territory, down one percent over the 12 months.
“Birth rates provide insight into long-term population growth as well as the current confidence of Australian families,” said Mr Rawnsley. “We haven’t seen such a sharp drop in births in Australia since the period of economic stagflation in the 1970s, which coincided with the initial widespread adoption of the contraceptive pill.”
Mr Rawnsley said many Australian couples delayed starting a family while the pandemic played out in 2020. The number of births fell from 305,832 in 2019 to 294,369 in 2020. Then in 2021, strong employment and vast amounts of stimulus money, along with high household savings due to lockdowns, gave couples better financial means to have a baby. This led to a rebound in births.
However, the re-opening of the global economy in 2022 led to soaring inflation. By the start of 2023, the Australian consumer price index (CPI) had risen to its highest level since 1990 at 7.8 percent per annum. By that stage, the Reserve Bank had already commenced an aggressive rate-hiking strategy to fight inflation and had raised the cash rate every month between May and December 2022.
Five more rate hikes during 2023 put further pressure on couples with mortgages and put the brakes on family formation. “This combination of the pandemic and rapid economic changes explains the spike and subsequent sharp decline in birth rates we have observed over the past four years,” Mr Rawnsley said.
The impact of high costs of living on couples’ decision to have a baby is highlighted in births data for the capital cities. KPMG estimates there were 60,860 births in Sydney in 2023, down 8.6 percent from 2019. There were 56,270 births in Melbourne, down 7.3 percent. In Perth, there were 25,020 births, down 6 percent, while in Brisbane there were 30,250 births, down 4.3 percent. Canberra was the only capital city where there was no fall in the number of births in 2023 compared to 2019.
“CPI growth in Canberra has been slightly subdued compared to that in other major cities, and the economic outlook has remained strong,” Mr Rawnsley said. “This means families have not been hurting as much as those in other capital cities, and in turn, we’ve seen a stabilisation of births in the ACT.”
This stylish family home combines a classic palette and finishes with a flexible floorplan
Just 55 minutes from Sydney, make this your creative getaway located in the majestic Hawkesbury region.