China Is Opening the First Regular Cargo Route Through the Arctic
Kanebridge News
    HOUSE MEDIAN ASKING PRICES AND WEEKLY CHANGE     Sydney $1,682,703 (+0.16%)       Melbourne $1,032,974 (+0.32%)       Brisbane $1,149,503 (-0.48%)       Adelaide $1,044,873 (+0.57%)       Perth $1,087,323 (+0.79%)       Hobart $838,358 (-0.10%)       Darwin $820,666 (-0.12%)       Canberra $979,872 (-0.24%)       National Capitals $1,138,269 (+0.14%)                UNIT MEDIAN ASKING PRICES AND WEEKLY CHANGE     Sydney $797,157 (-0.14%)       Melbourne $549,523 (-0.11%)       Brisbane $755,150 (-0.64%)       Adelaide $578,247 (+0.68%)       Perth $644,099 (+3.57%)       Hobart $571,049 (+0.07%)       Darwin $463,594 (-5.35%)       Canberra $477,768 (-0.27%)       National Capitals $625,689 (+0.06%)                HOUSES FOR SALE AND WEEKLY CHANGE     Sydney 14,358 (+213)       Melbourne 15,978 (-7)       Brisbane 11,458 (+121)       Adelaide 3,654 (+71)       Perth 8,904 (+103)       Hobart 691 (+10)       Darwin 180 (+11)       Canberra 1,209 (+48)       National Capitals 56,432 (+570)                UNITS FOR SALE AND WEEKLY CHANGE     Sydney 9,553 (+66)       Melbourne 6,618 (-48)       Brisbane 2,337 (+34)       Adelaide 604 (-6)       Perth 1,701 (+90)       Hobart 150 (-5)       Darwin 217 (-4)       Canberra 1,213 (+23)       National Capitals 22,393 (+150)                HOUSE MEDIAN ASKING RENTS AND WEEKLY CHANGE     Sydney $870 ($0)       Melbourne $600 ($0)       Brisbane $700 ($0)       Adelaide $660 (+$3)       Perth $750 ($0)       Hobart $628 (-$13)       Darwin $850 ($0)       Canberra $710 (+$10)       National Capitals $733 (+$)                UNIT MEDIAN ASKING RENTS AND WEEKLY CHANGE     Sydney $820 (-$5)       Melbourne $620 ($0)       Brisbane $620 (-$3)       Adelaide $550 (+$10)       Perth $700 (-$20)       Hobart $500 (-$30)       Darwin $675 ($0)       Canberra $590 (+$5)       National Capitals $648 (-$5)                HOUSES FOR RENT AND WEEKLY CHANGE     Sydney 6,676 (+151)       Melbourne 6,952 (+89)       Brisbane 3,472 (+4)       Adelaide 1,309 (+41)       Perth 2,174 (+11)       Hobart 210 (-11)       Darwin 61 (+5)       Canberra 431 (+4)       National Capitals 21,285 (+294)                UNITS FOR RENT AND WEEKLY CHANGE     Sydney 10,090 (-12)       Melbourne 6,145 (+91)       Brisbane 3,338 (+49)       Adelaide 409 (+12)       Perth 701 (+21)       Hobart 75 (0)       Darwin 102 (+4)       Canberra 717 (+47)       National Capitals 21,577 (+212)                HOUSE ANNUAL GROSS YIELDS AND TREND         Sydney 2.69% (↓)       Melbourne 3.02% (↓)     Brisbane 3.17% (↑)        Adelaide 3.28% (↓)       Perth 3.59% (↓)       Hobart 3.89% (↓)     Darwin 5.39% (↑)      Canberra 3.77% (↑)        National Capitals 3.35% (↓)            UNIT ANNUAL GROSS YIELDS AND TREND         Sydney 5.35% (↓)     Melbourne 5.87% (↑)      Brisbane 4.27% (↑)      Adelaide 4.95% (↑)        Perth 5.65% (↓)       Hobart 4.55% (↓)     Darwin 7.57% (↑)      Canberra 6.42% (↑)        National Capitals 5.38% (↓)            HOUSE RENTAL VACANCY RATES AND TREND       Sydney 1.4% (↑)      Melbourne 1.5% (↑)      Brisbane 1.2% (↑)      Adelaide 1.2% (↑)      Perth 1.0% (↑)        Hobart 0.5% (↓)       Darwin 0.7% (↓)     Canberra 1.6% (↑)      National Capitals $1.1% (↑)             UNIT RENTAL VACANCY RATES AND TREND       Sydney 1.4% (↑)      Melbourne 2.4% (↑)      Brisbane 1.5% (↑)      Adelaide 0.8% (↑)      Perth 0.9% (↑)      Hobart 1.2% (↑)        Darwin 1.4% (↓)     Canberra 2.7% (↑)      National Capitals $1.5% (↑)             AVERAGE DAYS TO SELL HOUSES AND TREND         Sydney 34.7 (↓)       Melbourne 33.6 (↓)     Brisbane 39.0 (↑)      Adelaide 32.0 (↑)        Perth 42.6 (↓)       Hobart 30.0 (↓)       Darwin 21.9 (↓)       Canberra 33.2 (↓)       National Capitals 33.4 (↓)            AVERAGE DAYS TO SELL UNITS AND TREND         Sydney 33.6 (↓)       Melbourne 31.2 (↓)     Brisbane 40.9 (↑)      Adelaide 32.6 (↑)        Perth 41.8 (↓)     Hobart 31.3 (↑)        Darwin 43.1 (↓)     Canberra 40.5 (↑)        National Capitals 36.9 (↓)           
Share Button

China Is Opening the First Regular Cargo Route Through the Arctic

China is launching the first regular Arctic cargo route to Europe, offering faster journeys and lower fuel costs as melting ice and Red Sea risks reshape global shipping.

By
Tue, Aug 18, 2026 5:21pmGrey Clock 4 min
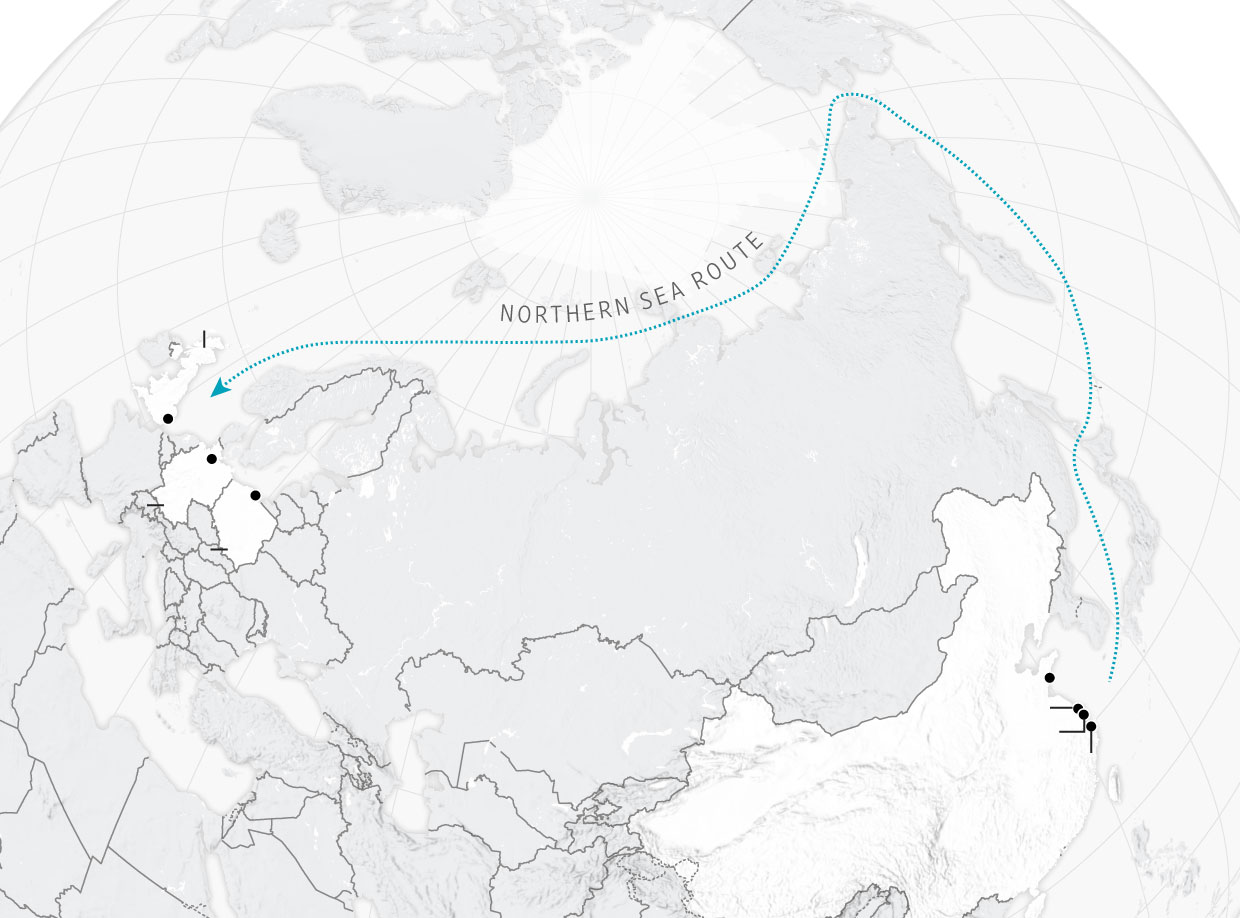
Note: Usual Northern Sea Route shown for illustrative purposes Source: Sea Legend Daniel Kiss/WSJ

Shipping cargo through an Arctic shortcut never made economic sense—until now.

Climate change and war in the Middle East are flipping the math that previously kept ships plying longer routes from Asia to Europe. A Chinese company on Saturday is starting the first regular cargo service to Europe through Arctic waters, seeking to reap the benefits of quicker travel time and less fuel use.

The shipper Sea Legend will dispatch the Dubai Tower from Ningbo, China, to Felixstowe in the U.K. on what it calls the Arctic Express, following a route along Russia’s north coast. The voyage by the vessel, which is capable of carrying 1,740 20-foot containers, is the biggest commercial step in the Arctic since a Maersk containership first completed the route in 2018.

Global warming is a big factor behind the new route, but it is not the only one. Nearly half the Arctic region’s summer ice—an area four times the size of Texas—has melted over five decades, clearing a fairly reliable path in the summer months. Meanwhile, high oil prices and attacks by Houthi rebels in the Red Sea have made the traditional routes costlier and more dangerous.

Members of China's 16th Arctic Ocean scientific expedition team take selfies on the ice surface.
Members of a Chinese scientific expedition team on surface ice in the Arctic Ocean this week. Wen Jinghua/Xinhua/ZUMA Press

Beyond that, Beijing has ambitions to play a role in the Arctic’s future, lending a geopolitical dimension to the Chinese company’s shipping route.

Last year Sea Legend completed a trial run from Asia to Europe in a record 20 days. That is roughly half the time of a voyage via Africa’s Cape of Good Hope that many carriers now take because of the Red Sea uncertainty.

Fuel accounts for 70% or more of the costs while at sea, said Alan Murphy, a former Maersk analyst who runs research firm Sea-Intelligence.

Saving fuel by shortening the journey doesn’t automatically make a route profitable. Insurance premiums for the Arctic are 40% higher than the Cape of Good Hope route, said Jonathan Steenberg, an economist at credit insurer Coface. Sea Legend’s Arctic vessels are relatively small. And even after warming, an icebreaker is still sometimes needed to help the cargo ship.

But if the ship can go without an icebreaker, Coface said the Arctic route is now cheaper than a Cape of Good Hope voyage in some circumstances. It estimated that at current oil prices of around $90, the cost of shipping liquid bulk such as liquefied natural gas could drop roughly 33% compared with the Cape of Good Hope routewhile dry bulk goods such as cereals would cost about 8% less.

The container ship Istanbul Bridge being unloaded by large blue and red cranes at the port of Gdansk.
A containership operated by Sea Legend in the port of Gdansk, Poland. jackowski/epa/Shutterstock

The route is only passable in the summer and fall. Sea Legend plans eight voyages between August and late October, before conditions get too icy.

“It’s not the Suez Canal but it’s a significant number for the Arctic. It shows there is potential,” said Malte Humpert, founder of the U.S.-based Arctic Institute and author of a book on Chinese shipping in the Arctic.

Even in summer, ships have to navigate around dangerous ice floes and deal with rapidly changing weather. By the end of the shipping season in October, the sky is dark most of the time.

A Russian tanker suffered serious damage to its hull while sailing along the Arctic route despite being assisted by an icebreaker, its insurer, AlfaStrakhovanie, said Thursday, adding that it paid out roughly $650,000.

Coface estimates 3.5% of trade among East Asia, Europe and North America will be able to use Arctic routes within the next five years, representing $64 billion in goods.

Last summer, a record 23 cargo ships transited the Northern Sea Route, which hugs Russia’s north coast. That is tiny compared with the Suez Canal, where more than 30 ships transited daily.

Western companies that want to follow in Sea Legend’s path have to navigate treacherous politics. Russia claims sovereignty over the entire Northern Sea Route and permits for ship traffic are issued by its state-controlled nuclear operator, Rosatom.

Aerial view of a port with many cargo ships, red cranes, and rows of stacked shipping containers.
The Dubai Tower’s route will begin in the Chinese port of Ningbo. Huang Zongzhi/ZUMA Press

“Western companies are in a tricky position,” said Humpert of the Arctic Institute. “At what point do they jump back in the water? When does it become economically necessary, and how do you weigh that against environmental risks and the political dimension?”

An alternative Arctic route, the Northwest Passage that connects the Atlantic and Pacific oceans via the Canadian Arctic, is less passable because it is dominated by narrow waterways where ice gets bunched up. The highest number of cargo ships completing the passage in a year was 13, in 2023.

China has declared itself a near-Arctic state despite not having access to Arctic waters. It depends on Russia’s goodwill to use the Northern Sea Route.

“Beijing is concerned that if they don’t establish a significant strategic presence in the Arctic now, it’s going to be more difficult in the future,” said Marc Lanteigne, expert in polar geopolitics at the Arctic University of Norway in Tromsø. However, he said, “China needs to be careful not to give the impression that they are trying to challenge the strategic order in the Arctic.”

Sea Legend didn’t respond to requests for comment.

Any polar venture contributes to China’s quest to master Arctic travel. The country also has three icebreakers and a support vessel currently on a monthslong scientific expedition north of Greenland. Scientific and commercial voyages can yield data about natural resources awaiting below melting ice caps and information for positioning nuclear-armed submarines.


MOST POPULAR

For Central Element, the start of work at Pearl represents another step in the company’s growing eastern suburbs pipeline.

All three vehicles will form part of a broader charitable initiative benefiting Big Brothers Big Sisters of America, the American Red Cross and Starlight Children’s Foundation

Related Stories
Money
ASX Reporting Season 2026: 5 Biggest Winners and Losers So Far
By Ruba Jaajaa 10/09/2026
Money
The Stock Market’s Breezy Summer Is Over. Investors Beware.
By Hannah Erin Lang 08/09/2026
Prestige
Girard-Perregaux Gives The 39mm Laureato Fifty A Tourbillon
By Ruba Jaajaa 07/09/2026
ASX Reporting Season 2026: 5 Biggest Winners and Losers So Far

Overall, the season showed that share prices react less to whether profits rose or fell than to the gap between results and expectations

By Ruba Jaajaa
Thu, Sep 10, 2026 5 min

Reporting season has once again reminded investors that a strong profit does not guarantee a rising share price, and a large loss does not always trigger a sell-off. What matters most is how each result compares with expectations and, increasingly, what management says about the year ahead. During the August 2026 season, companies offering credible turnarounds or unexpectedly strong guidance were rewarded handsomely, while those flagging weaker margins, slowing demand or greater uncertainty were punished.

The following ranking draws on Morningstar’s review of 164 ASX-listed companies and measures each company’s share-price movement on the day it reported. This captures the market’s immediate response to the earnings announcement, before subsequent economic developments, dividends and company-specific news cloud the picture. Here are the five biggest winners, and the five hardest-hit losers, of the season so far.

The five winners

1. Bapcor (ASX:BAP): +41.0%

Bapcor delivered reporting season’s largest relief rally after presenting early evidence that its troubled automotive-parts business was stabilising. Although underlying revenue fell 1.8% to $1.92 billion and underlying NPAT collapsed 85% to $10.8 million, underlying EBITDA of $152.5 million exceeded guidance.

More importantly, working-capital initiatives released $68.5 million in the second half, lifting cash conversion to 109.4% and reducing net debt by 63% to $135 million. The statutory loss was $431.6 million, largely because of non-cash impairments. Investors focused on improving operational momentum, stronger liquidity and management’s expectation of modest FY27 revenue growth.

2. Zip Co (ASX:ZIP): +18.2%

Zip comfortably surpassed its FY26 targets, sending the buy-now-pay-later provider’s shares sharply higher. Transaction volume rose 23% to $16.7 billion, while cash earnings before tax, depreciation and amortisation jumped 58% to a record $268.9 million. Statutory profit climbed 46% to $116.4 million, and the cash operating margin expanded by 4.2 percentage points to 20%.

The strongest signal was guidance for FY27 cash earnings of $340 million—around 26% growth and above analysts’ forecasts. US transaction volume increased 42.5% and now represents three-quarters of group volume, offsetting weaker customer activity in Australia.

3. CSL (ASX:CSL): +17.3%

CSL’s result was hardly spectacular in isolation, but it cleared a market bar that had fallen dramatically following earlier downgrades and restructuring announcements. Underlying NPATA was US$3.1 billion, down 2% in constant-currency terms, while operating cash flow reached US$3.51 billion.

CSL maintained its full-year dividend at US$2.92 per share and completed a A$1 billion buyback. The real catalyst was FY27 guidance for approximately 5% underlying profit growth, compared with market expectations closer to 2%. After an extended period of earnings disappointments, investors interpreted the outlook as evidence that CSL’s core plasma business was approaching a sustainable recovery.

4. Judo Capital (ASX:JDO): +16.9%

Judo Capital demonstrated strong operating leverage as its specialist business-lending franchise expanded. Full-year profit before tax rose 34% to $168.1 million, while pre-provision profit increased 42%. Gross loans and advances grew 18% to $14.7 billion, reaching the top of the bank’s guidance range and comfortably exceeding broader system growth.

Deposits increased 24% to $12.2 billion, return on equity improved by 1.1 percentage points to 6.4%, and earnings per share rose 29% to 9.9 cents. Reaffirmation of the FY27 outlook gave investors confidence that loan growth could continue without sacrificing margins or credit quality.

5. Super Retail Group (ASX:SUL): +15.8%

The owner of Supercheap Auto, rebel, BCF and Macpac reported record sales of $4.2 billion, up 3.2%, despite cautious discretionary spending. Profitability went backwards: normalised profit before tax fell 7% to $306 million and normalised NPAT declined 2.8% to $226 million as transformation spending weighed on margins. Nevertheless, the result exceeded subdued expectations, online sales grew 5.3% and membership across the group’s loyalty programs reached 13.1 million. Investors were also encouraged by positive early FY27 trading, stable gross margins and continued market-share gains. A fully franked 33-cent final dividend added to the appeal.

The five losers

1. Hansen Technologies (ASX:HSN): –21.2%

Hansen’s historic result met expectations, but investors recoiled from its outlook. The utility and communications software provider achieved an underlying EBITDA margin of 31%, exceeding its 30% target, while generating strong cash flow. However, management designated FY27 an “investment and transition year”, signalling a roughly five-percentage-point margin contraction as spending on products, sales capabilities and organisational changes increased.

Revenue had already been broadly flat, leaving investors concerned that the investment program would depress earnings before new growth appeared. Leadership changes, including the chief executive’s departure, added uncertainty. Management expects revenue growth and margins above 30% to return in FY28, but the market was unwilling to wait.

2. Life360 (ASX:360): –19.4%

Life360’s headline growth was impressive: quarterly revenue rose 38% to US$159 million, subscription revenue increased 31%, and adjusted EBITDA climbed 53% to US$31.1 million. Monthly active users reached 102.4 million and paying circles grew 27% to 3.2 million. The sell-off reflected expectations rather than a collapsing business.

Net income fell 18%, the net margin contracted from 6% to 3%, hardware shipments dropped 18%, and full-year EBITDA guidance was merely maintained. After a strong valuation run, investors wanted a larger upgrade and clearer evidence that heavy investment in advertising, international expansion and artificial intelligence would generate additional earnings.

3. PEXA Group (ASX:PXA): –17.0%

PEXA reported a 7% increase in continuing-operations revenue and 12% EBITDA growth to $152 million, accompanied by a two-percentage-point margin expansion. Free cash flow increased 39%, suggesting the core Australian electronic-conveyancing platform remained highly profitable. Investors instead concentrated on management’s warning that property-transfer volumes could decline, alongside regulatory uncertainty surrounding the fees PEXA can charge.

The company is also continuing to invest heavily in its loss-making international expansion. Morningstar considered the market reaction excessive, arguing that structural transfer-volume assumptions had not materially changed, but the combination of softer near-term activity and regulatory risk overwhelmed the respectable headline numbers.

4. SEEK (ASX:SEK): –14.3%

SEEK produced solid FY26 figures, including 10% revenue growth to $1.20 billion, a 15% rise in EBITDA and 28% growth in adjusted earnings per share. It also lifted its fully franked annual dividend by 13% to a record 52 cents. Those achievements were overshadowed by falling paid job-ad volumes and cautious FY27 assumptions.

The statutory accounts included a $201 million loss from the SEEK Growth Fund and $377 million of significant items, making the headline result considerably less attractive. Investors were particularly concerned that economic weakness could limit volumes while the company continued investing in platform integration and artificial-intelligence products.

5. JB Hi-Fi (ASX:JBH): –12.3%

JB Hi-Fi’s full-year result was broadly respectable, with group sales rising 5% to $11.1 billion and underlying earnings per share increasing 6% to $4.48. The damage came from its current-trading update. Australian sales were almost flat during the June quarter and deteriorated further in July, while earnings in the core Australian electronics business fell 3.6%.

Housing-related categories were particularly weak as higher living costs and interest rates constrained household budgets. With JB Hi-Fi entering the season on a demanding valuation, an in-line historic result was not sufficient: the loss of sales momentum prompted investors to rapidly reduce their expectations for FY27.

Overall, the season showed that share prices react less to whether profits rose or fell than to the gap between results and expectations. Bapcor was rewarded for being less troubled than feared, while several fundamentally profitable companies were punished because their outlooks failed to justify elevated valuations.

MOST POPULAR

Odd Culture Group brings a new kind of after-dark energy to the CBD, where daiquiris, disco and design collide beneath the city streets.

Advertising legend John Singleton unveils an exclusive 16-residence Caroline Bay development, marking his latest high-end property play on the Central Coast.

Related Stories
Lifestyle
A NEW SEASON FOR AUSTRALIA’S MOST EXPRESSIVE WINES
By Jeni O'Dowd 23/02/2026
Lifestyle
CITIZEN KANEBRIDGE CAR CLUB PARTNERS WITH BULLRUSH RALLY TO UNLOCK ELITE MOTORING EXPERIENCES
By Staff Writer 26/02/2026
NSW
Abadeen Plans 100 New Homes at Mosman’s Former Honeysuckle Garden Site
By Staff Writer 04/08/2026
0
Your Cart
Your cart is emptyReturn to Shop