Eurozone’s Economy Outpaced China and U.S. in 2022
The currency-area grew at a faster clip than its global peers, reversing traditional positions

 4 min
4 min
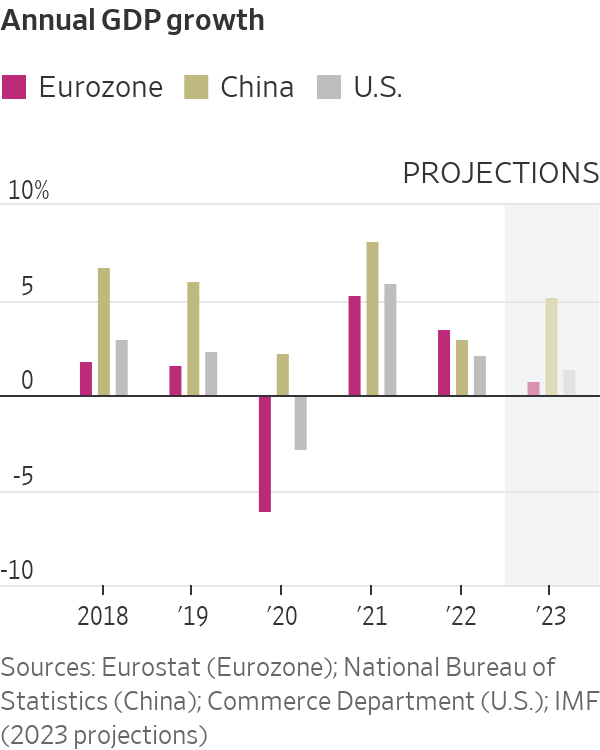
The eurozone economy grew faster than China and the U.S. last year, underlining how the fading Covid-19 pandemic continues to scramble traditional patterns of global growth.
Figures released by the European Union’s statistics agency Tuesday showed the currency- area’s economy grew at an annualised rate of 0.5% as higher energy costs weighed on household spending. This translated into 3.5% growth in gross domestic product for 2022 as a whole, a faster rate than seen in either China or the U.S.
This is unusual. For decades, the big three engines of the global economy have had a pretty stable ranking: China grew fastest, followed by the U.S. and then the eurozone. This all changed last year because of the staggered manner in which major economies reopened in the wake of the pandemic.
Figures released Thursday showed the U.S. economy grew by 2.1% in 2022, a sharp slowdown from the 5.9% rate of expansion recorded in 2021. Earlier this month, China’s statistics agency released figures that showed the world’s second-largest economy grew by 3%, down from 8% the previous year.
The last time that the combined national economies that make up the eurozone grew at a faster pace than that of either China or the U.S. was in 1974. The U.S. economy has typically outpaced Europe’s over recent decades largely because its population has grown more quickly. More recently, the U.S. has led Europe in the development of fast-growing technology sectors.
Last year’s unusual growth ranking largely reflects the impact of the Covid-19 pandemic on the world economy, with the timing of lockdowns and re openings leading to big swings in growth, as well as high rates of inflation.
It is an effect that is unlikely to last. As China abandons its zero-Covid policy, it is likely to reclaim its position as the fastest-growing of the big three economic areas. And the war in Ukraine is having a bigger impact on the economy of Europe than that of the U.S. or China, as the slowdown in the last quarter of 2022 testifies.
“2022 was just a weird, weird year,” said European Central Bank President Christine Lagarde during a panel at the World Economic Forum’s annual meeting in Davos earlier this month. “Those are not normal numbers, this is not the usual ranking that you have.”
In the eurozone, the influence of the pandemic on the economy was so strong last year that it offset that of Russia’s invasion of Ukraine and the surge in energy prices it prompted.
While China experienced a series of lockdowns in pursuit of its zero-Covid policy, the eurozone enjoyed its first full year without tight restrictions, and a boost to activity that the U.S. had experienced a year earlier.
The big three economies locked down hard in 2020. But the U.S. reopened more fully from early 2021, outpacing the eurozone and China in the first three months of that year in particular. The eurozone’s reopening boost started later, and carried over into the first half of 2022 as its key tourism industry rebounded.
This year is likely to see the pandemic continue to have a big impact on growth—this time in China. The country lifted many of its zero-tolerance pandemic controls in early December in an abrupt change of course. While that led to an increase in Covid-19 infections and deaths, it also opened the door to a sharp economic rebound in the world’s second-largest economy.
For this year, the United Nations expects China’s economy to grow by 4.8%. It expects both the U.S. and the eurozone to slow, to 0.4% and 0.2% respectively. If it is correct, the normal growth ranking will be restored, although at lower-than-normal rates of growth. And from 2024, the pandemic’s impact is set to wane, unless a more deadly, rapidly-spreading coronavirus variant emerges.
“By 2024 we should be out of the woods,” said Hamid Rashid, head of the U.N.’s global economic monitoring unit. “We are still having the lingering impact of the pandemic in 2022 and 2023.”
High inflation rates, partly a legacy of the pandemic, are also expected to fade by 2024. Inflation rates began to surge in early 2021 as the reopening of the U.S. and other economies led to a surge in demand for goods and services at a time when global supply chains were still impaired.
According to a measure of supply-chain pressures compiled by the Federal Reserve Bank of New York, the blockages caused by the pandemic reached a peak at the end of 2021, and then eased steadily through the first nine months of last year. But that improvement in supply chains stalled in the final three months of 2022 as China imposed lockdowns to counter fresh outbreaks of Covid-19. Supply chains seem set to continue their slow return to prepandemic conditions in 2023 after the zero-tolerance strategy was abandoned.
Rates of inflation around the world appear to be easing, but it has taken unusually aggressive action by global central banks to get to that point. The Federal Reserve has raised interest rates by more than 4 percentage points since March, the largest move in a single year since 1980. The European Central Bank has moved at a slower pace, pushing up its policy rate by 2.5 percentage points starting in July, but that is the fastest increase since it was founded in 1998.
Both central banks are expected to raise their key interest rates this week, with the ECB likely to tighten more than the Fed. Further increases in borrowing costs will affect businesses and households not just in the U.S. and Europe, but around the world.
“The global effects are real, but they are not taken into account by the systemically important central banks,” said Mr. Rashid at the U.N., “it is harder for developing countries to borrow and invest.”
 Copyright 2020, Dow Jones & Company, Inc. All Rights Reserved Worldwide. LEARN MORE


A record-breaking $11 million sale at The Centennial Collection has set a new benchmark for luxury apartment living in Bondi Junction.

As interest rates, inflation and market sentiment fluctuate, investors are being urged to focus on data, not panic.


The Federal Budget may have softened some of its proposed tax reforms, but it has exposed a bigger issue: too many families are relying on wealth structures that no longer reflect the realities of modern life.
3 min
For many Australians, the 2026 Federal Budget initially felt like a direct challenge to the way wealth is created, held and transferred between generations.
The headlines were immediate: changes to capital gains tax, reforms to discretionary trusts, restrictions on negative gearing and increased scrutiny of investment structures. Unsurprisingly, affluent families, business owners and investors began asking the same question:
Is the way we hold our wealth still fit for purpose?
In recent days, the government has announced several significant amendments following industry consultation and public feedback, including exempting testamentary trusts from the proposed 30 per cent minimum tax and expanding capital gains tax concessions for small businesses.
The backdown is welcome. But it also highlights something much bigger.
This Budget has accelerated a conversation that many Australian families have been postponing for years.
The conversation is not really about tax. It is about wealth stewardship.
For decades, Australians have built wealth through businesses, property, investments and careful long-term planning. Yet many families have not revisited the legal structures surrounding those assets in years, sometimes decades.
We often see clients who have spent years building significant wealth, only to discover their legal arrangements no longer reflect their current circumstances.
Their children are now adults. They may own multiple properties.
They may have sold a business, entered a second marriage, become grandparents or accumulated digital assets that did not exist when their original estate plans were prepared.
The trust that distributes income may need to be reconsidered. The bucket company may no longer be so attractive.
The Budget has simply exposed a reality that already existed: wealth structures cannot remain static while life continues to evolve.
Importantly, trusts themselves are not the issue.
Trusts are legitimate planning tools that provide flexibility, protection and continuity. When used appropriately, they allow families to adapt to changing circumstances over time.
And neither is tax the issue, really. Getting the fundamentals right is more important for long-term, sustainable wealth than a few favourable tax treatments around the edges.

The real issue is complacency.
Too often, families create structures and assume the job is done. It isn’t.
Estate planning is no longer a document you sign once and file away in a drawer. It is an ongoing process that should evolve alongside your life.
We are also seeing a broader shift in how Australians define wealth itself. It is no longer just the family home and an investment portfolio.
Modern wealth includes businesses, digital assets, cryptocurrency, intellectual property, frequent flyer points and increasingly complex family arrangements.
At the same time, Australians are living longer than ever before, meaning wealth may need to support multiple generations simultaneously. This creates new responsibilities and new risks.
How do you help your children enter the property market without exposing family wealth to relationship breakdowns?
How do you structure wealth so that it remains a source of opportunity rather than future conflict?
These are the questions families should be asking now.
The recent debate surrounding testamentary trusts also serves as an important reminder that policy decisions can have unintended consequences for vulnerable Australians. It is encouraging that the government has listened to feedback and clarified its position.
But the lesson remains: the wealth landscape is changing.
Increasingly, governments, regulators and tax authorities are paying closer attention to how wealth is held and transferred. That means families cannot afford to adopt a “set-and-forget” approach to their structures.
The families who will be best placed for the future are not necessarily those with the greatest wealth.
They are the families with the greatest clarity. Clarity around ownership, succession and governance. And clarity around how wealth will transition from one generation to the next.
Ultimately, preserving wealth is not about avoiding change.
It is about preparing for it.
Because the greatest risk is not change itself.
It is losing the ability to respond to it.
Anthony Hunt is Co-Founder of Wealth Lawyers and former COO of Westpac Private Bank. He advises business owners, investors and affluent Australian families on wealth protection, succession planning and intergenerational wealth transfer

Barnet, in North London, lays claim to two of the country’s most expensive roads to own a home.

Australia’s market is on the move again, and not always where you’d expect. We’ve found the surprise suburbs where prices are climbing fastest.