Frank Stella’s ‘Abra I’ to Lead at Christie’s Post-War to Present Sale

 2 min
2 min
More than 280 modern and contemporary artworks will be up for sale Friday at Christie’s Post-War to Present auction in New York.
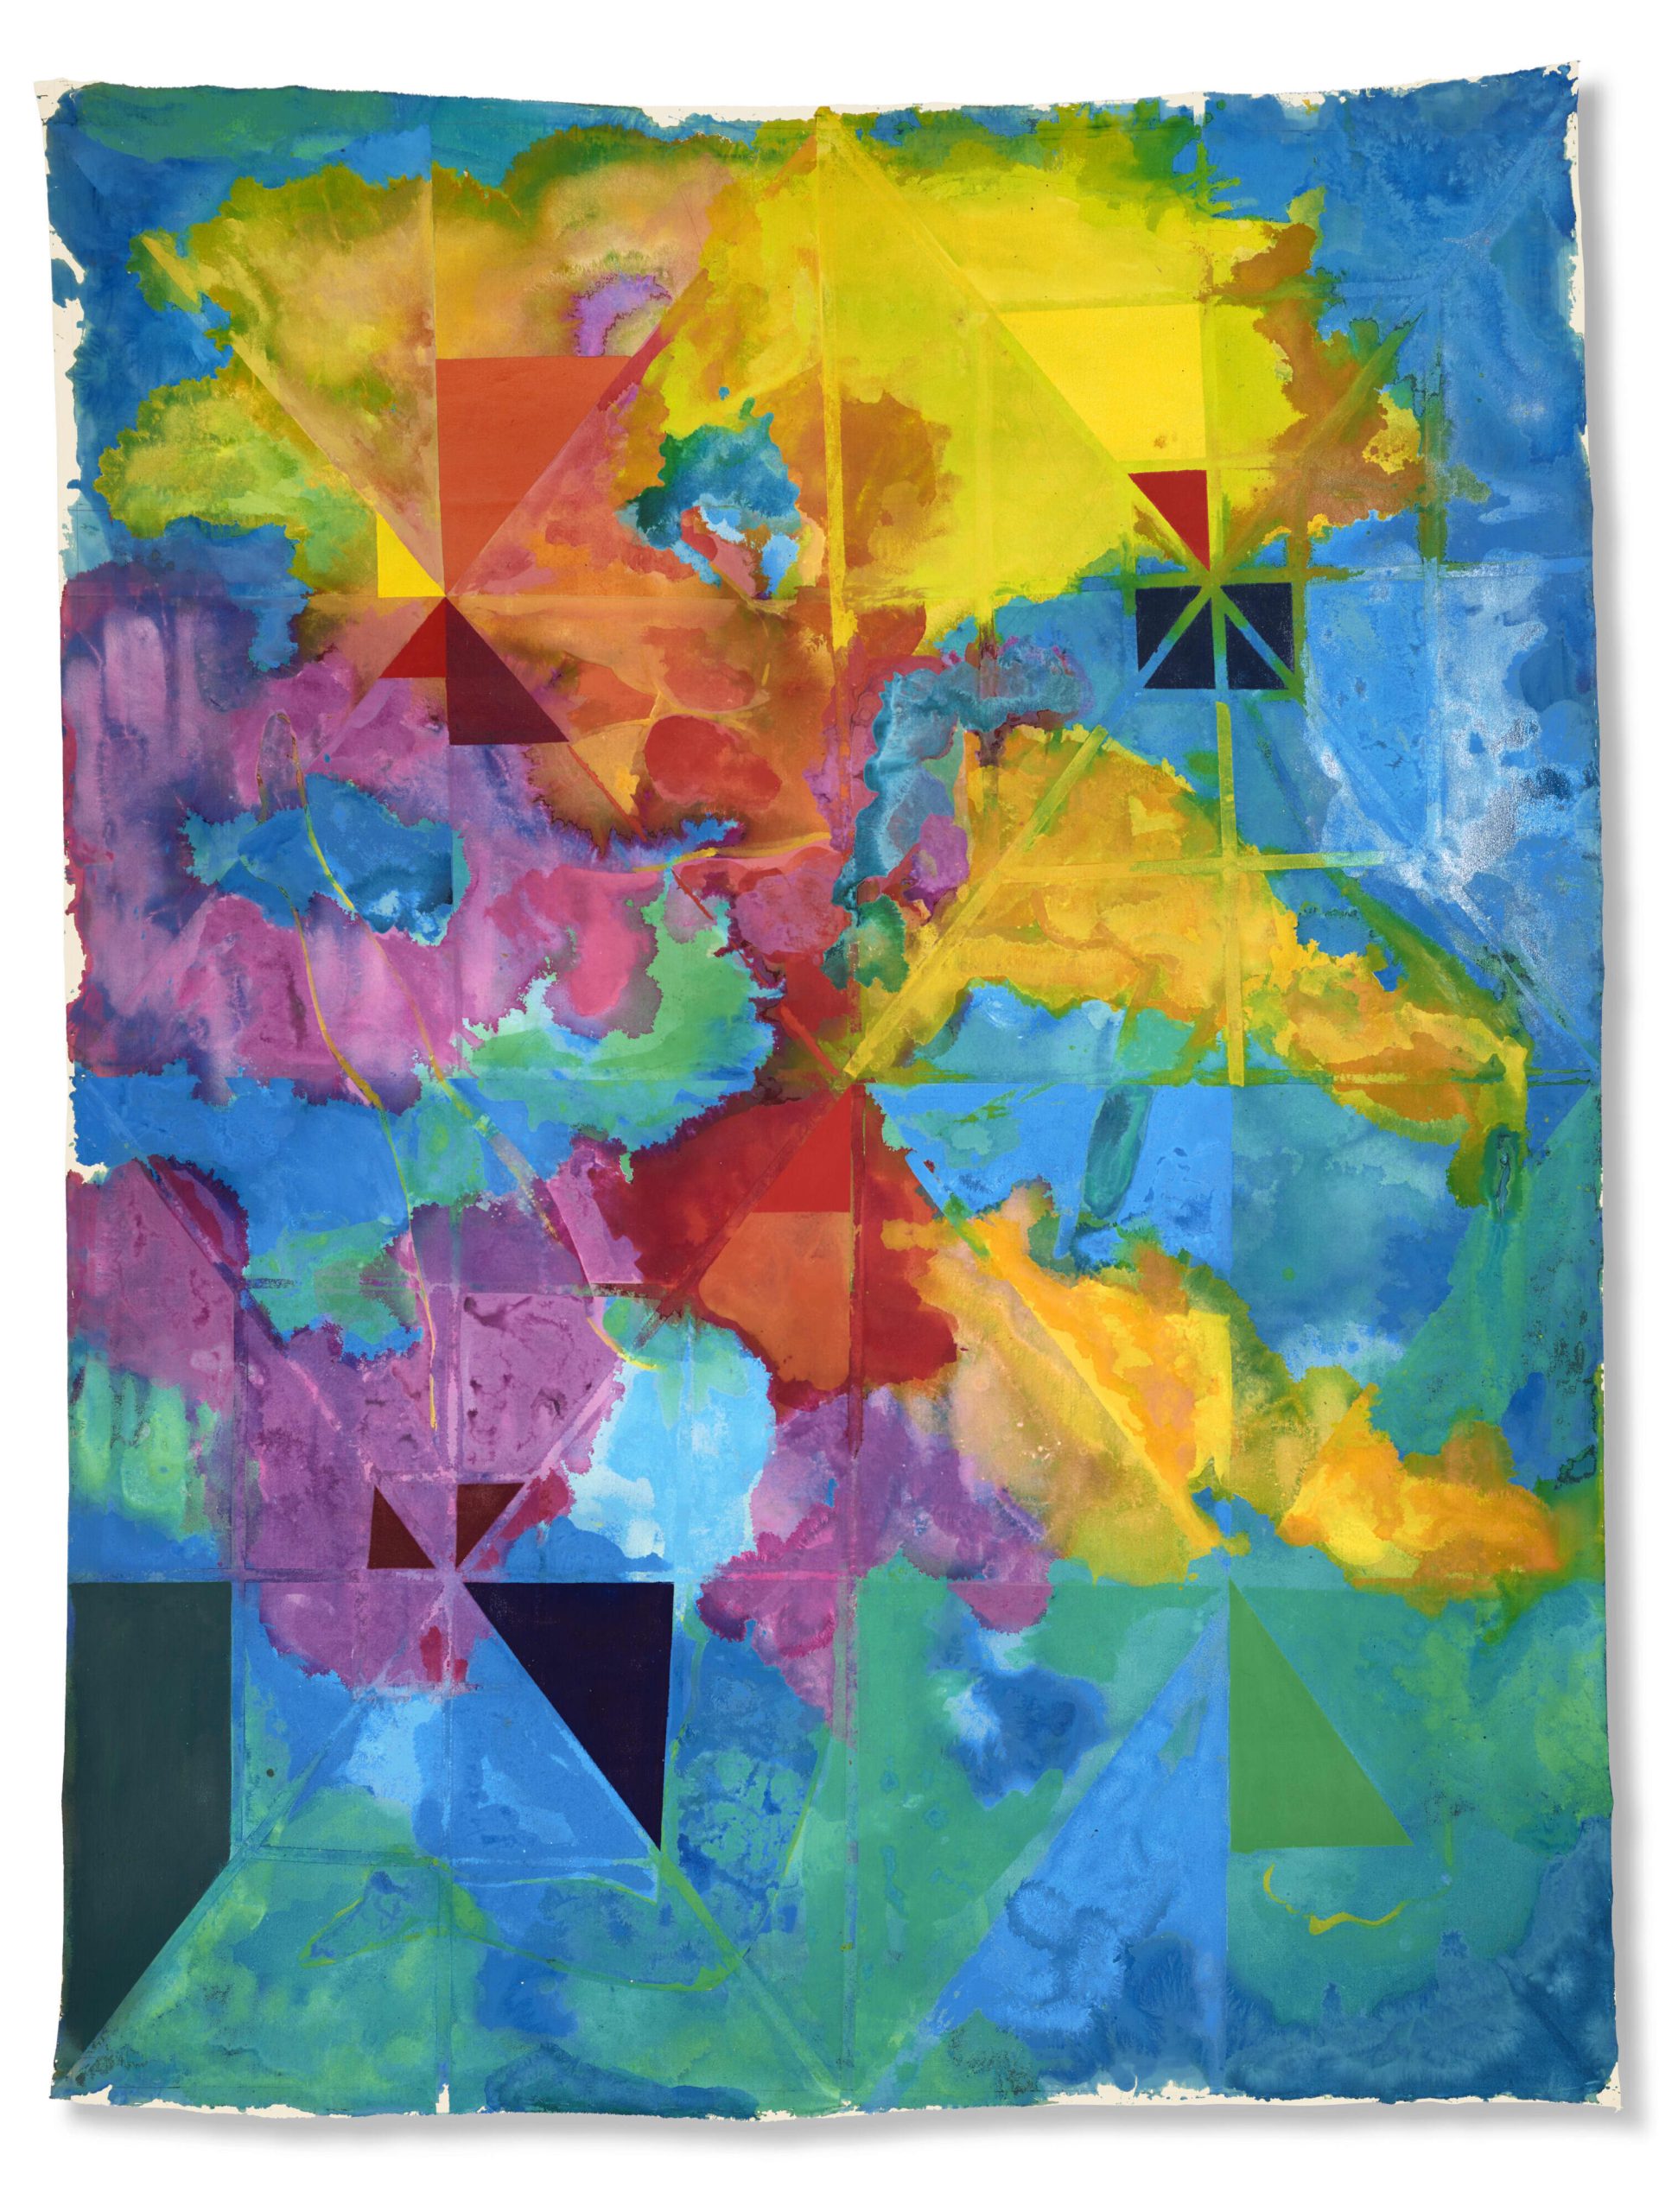
The live sale, which will be held at Christie’s Rockefeller Center sale room, has a low estimate of more than US$27 million and will be led by Frank Stella’s Abra I, 1968, which is estimated to fetch between US$1.2 million and US$1.8 million, according to a news release from Christie’s.
“Abra I is a fantastic example by Stella, a large-scale canvas from the protractor series,” says head of sale Julian Ehrlich. “It engages so many crucial aspects of his practice, including scale, geometry and colour, and has appeal to established post-war collectors and others who are just coming to historical art.”
Ehrlich, who has overseen the semiannual Post-War to Present sale since its first March 2022 auction, says his goal in curating the sale was to “assemble a thoughtful and dynamic auction” with works from both popular and lesser-known artists.
“With Post-War to Present, we really have a unique opportunity to share new artistic narratives at auction. It’s a joy to highlight new artists or artists who have been overlooked historically and be a part of that conversation in a larger art world context,” he says.
Christie’s
Works from a number of female artists who were pioneers of post-war abstract painting, including Helen Frankenthaler, Lynne Drexler, and Hedda Sterne, will be included. The auction will also include pieces from a group of Black artists from the 1960s to present day, including Noah Purifoy, Jack Whitten, and David Hammons, in addition to a Christie’s debut from Joe Overstreet (Untitled, 1970) and an auction debut from Rick Lowe (Untitled, 2021).
“The story of art is necessarily diverse,” Ehrlich says. “The sale itself is broad, with more than 280 works this season, and it has been fun to think through artists inside and outside of the canon that we can put forward as highlights of the auction.”
In addition to Abra I, other top lots include Tom Wesselmann’s Seascape #29, 1967, (with an estimate between US$800,000 and US$1.2 million); Keith Haring’s Andy Mouse, 1986, (also with an estimate between US$800,000 and US$1.2 million); and Jack Whitten’s Garden in Bessemer, 1986 (with an estimate between US$700,000 andUS$1 million).
“I think of the Post-War to Present sale as being especially dynamic … in the best case, even for someone deeply embedded in the market, there should be works which surprise and delight and are unexpected, as well as celebrated market-darlings and art-historical greats,” Ehrlich says.
 Copyright 2020, Dow Jones & Company, Inc. All Rights Reserved Worldwide. LEARN MORE


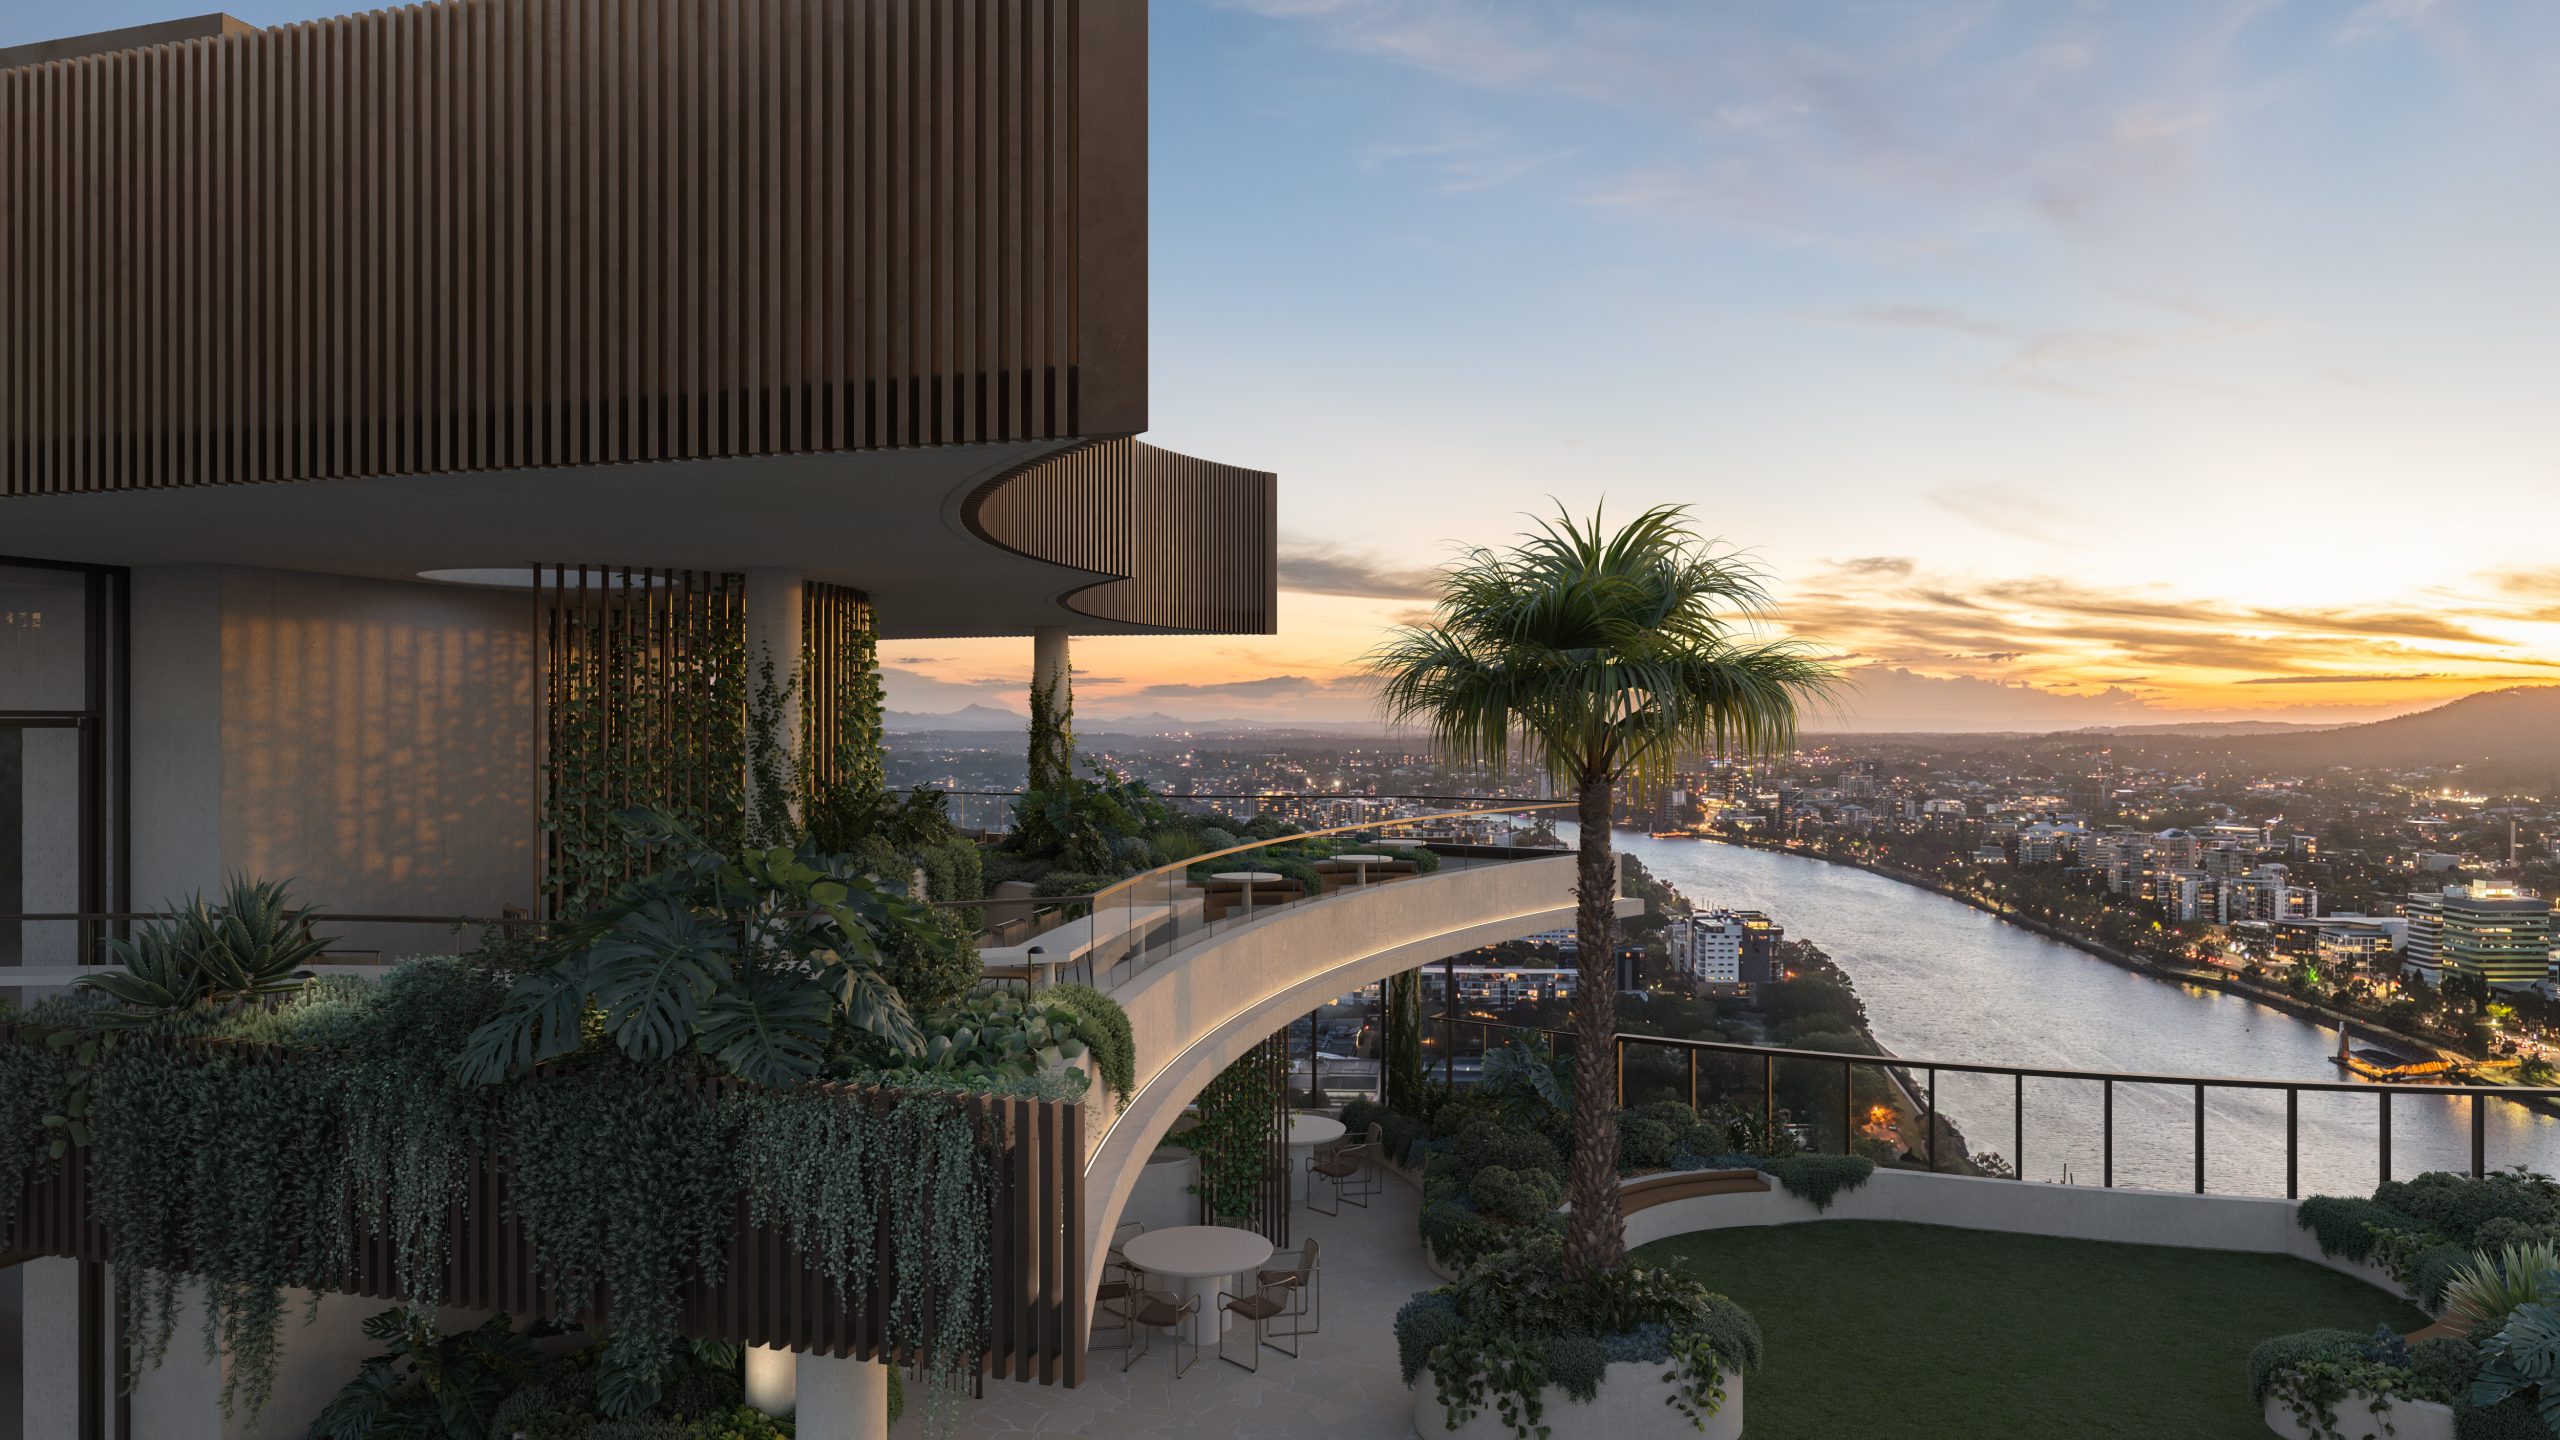
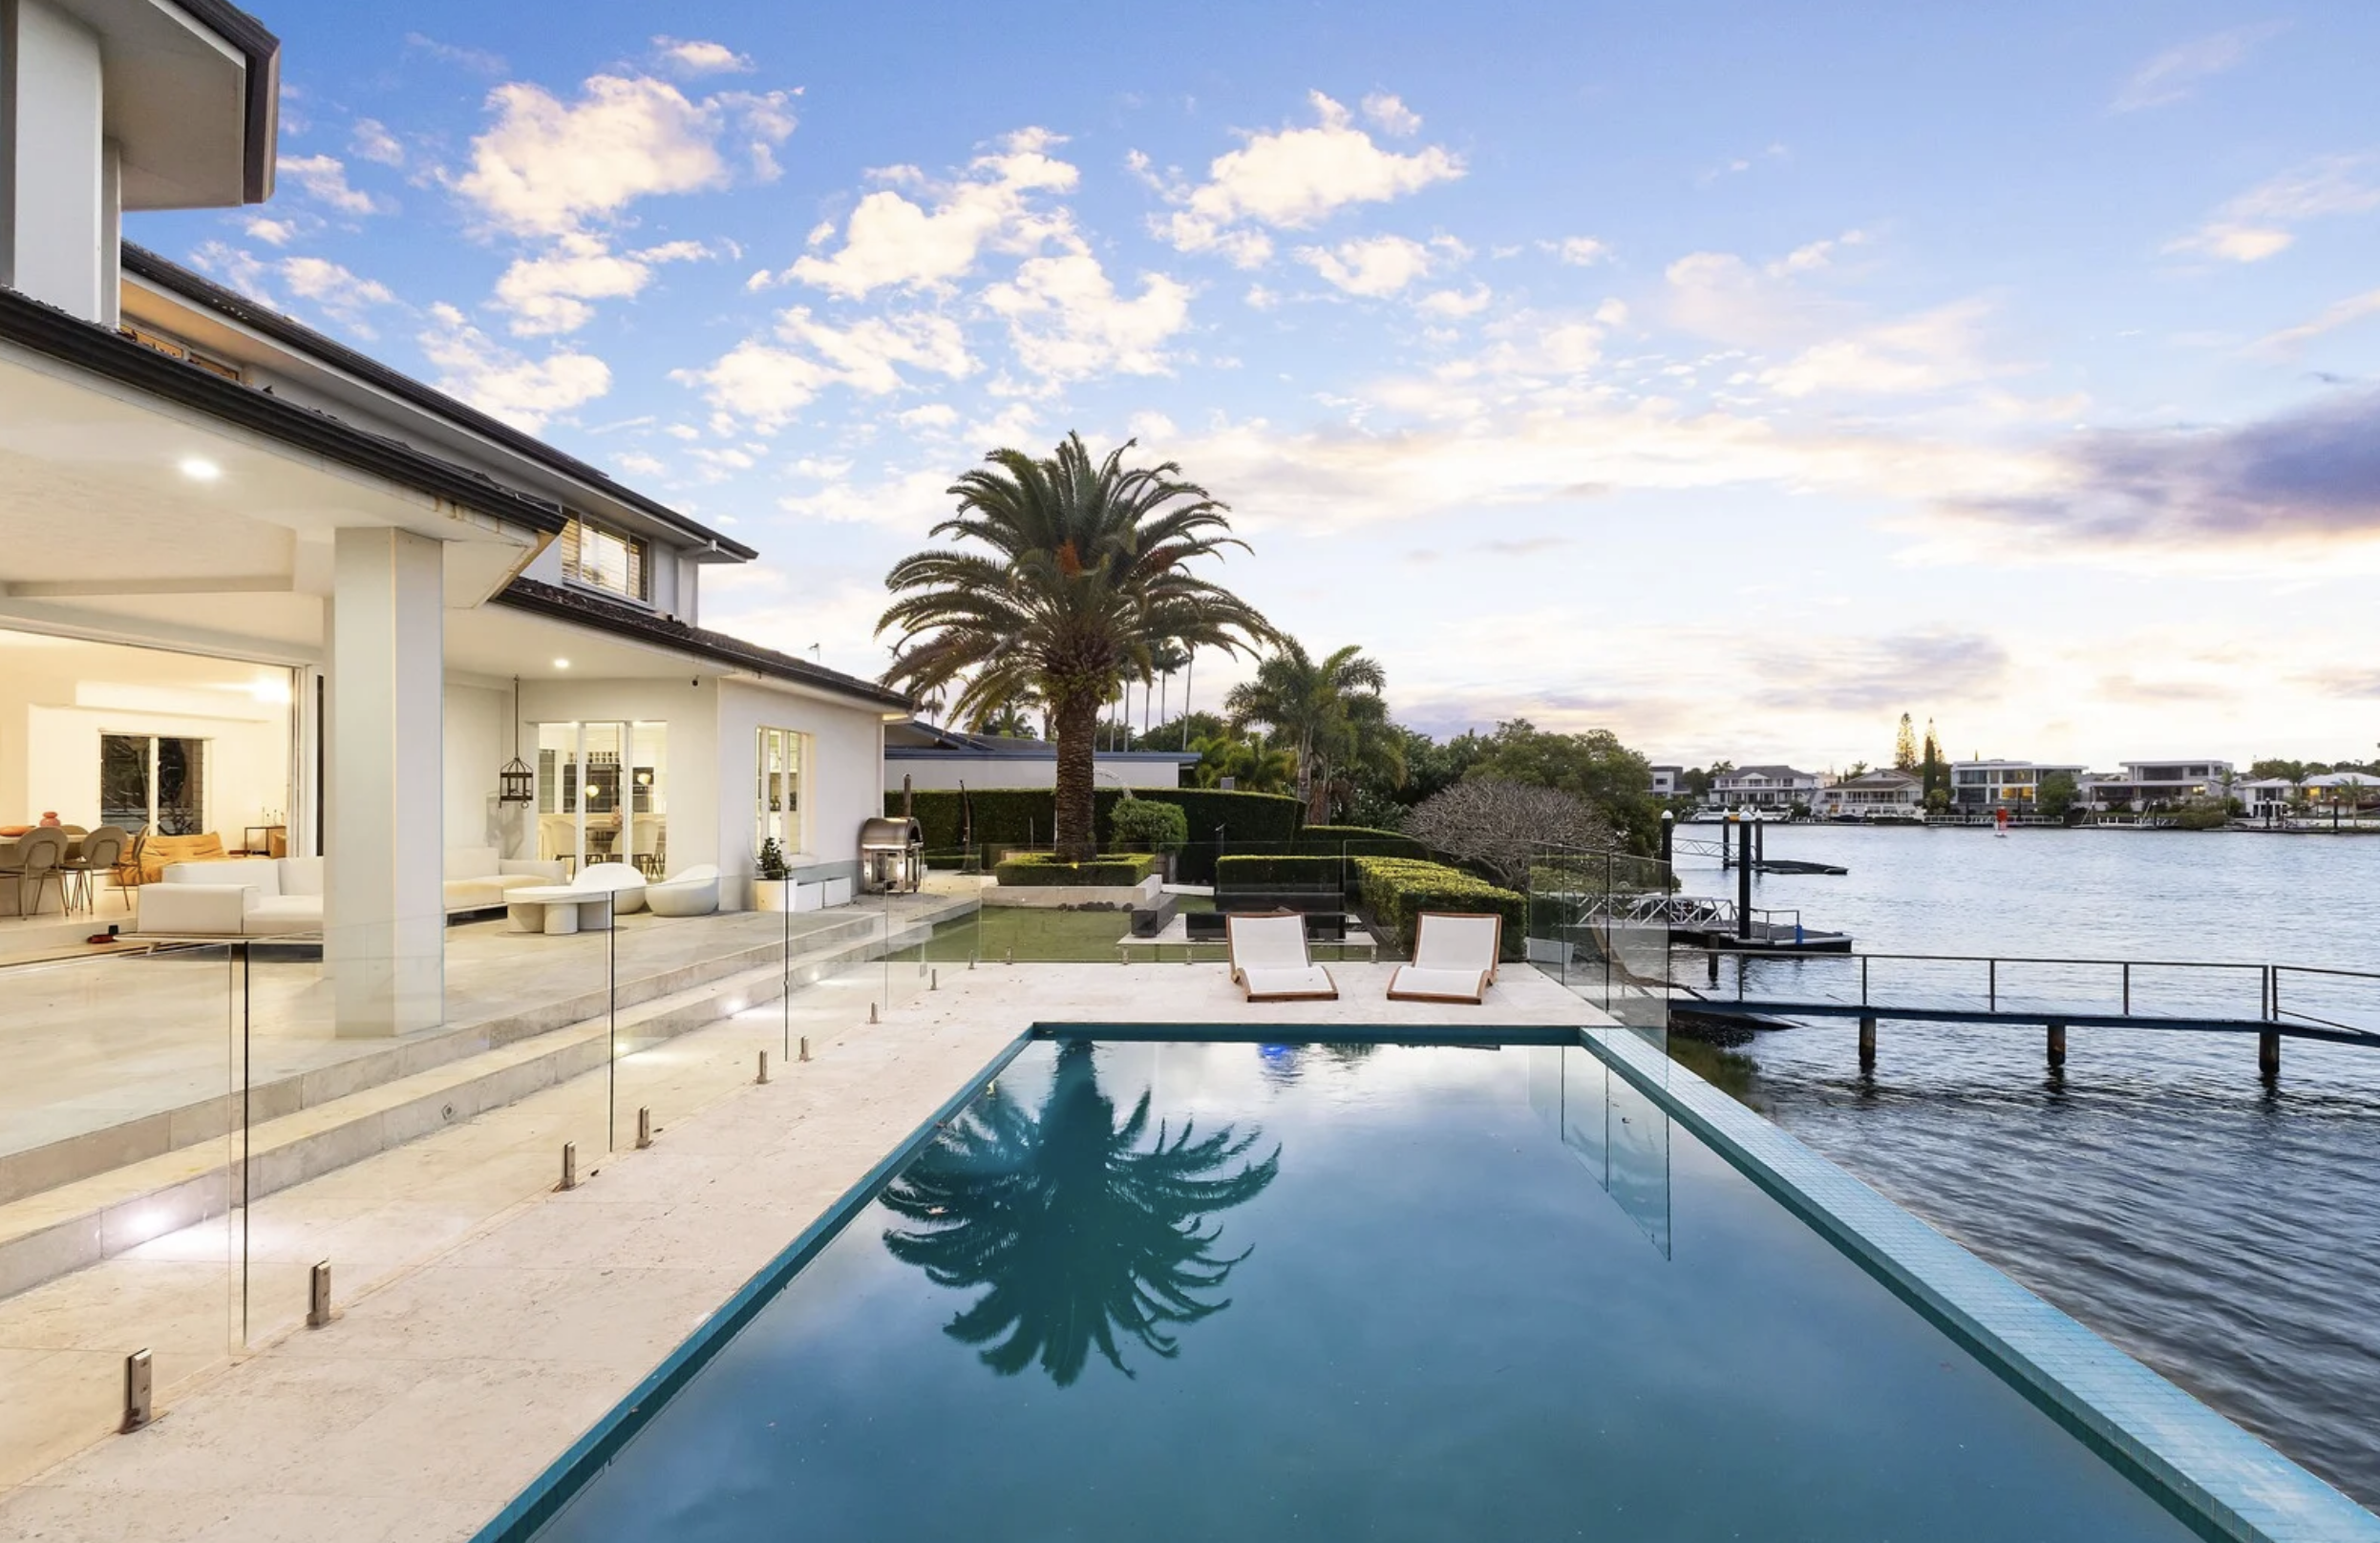
Set on one of the city’s last absolute riverfront sites, The Riversdale by Mosaic combines irreplaceable waterfront ownership with one of Brisbane’s most significant residential opportunities.
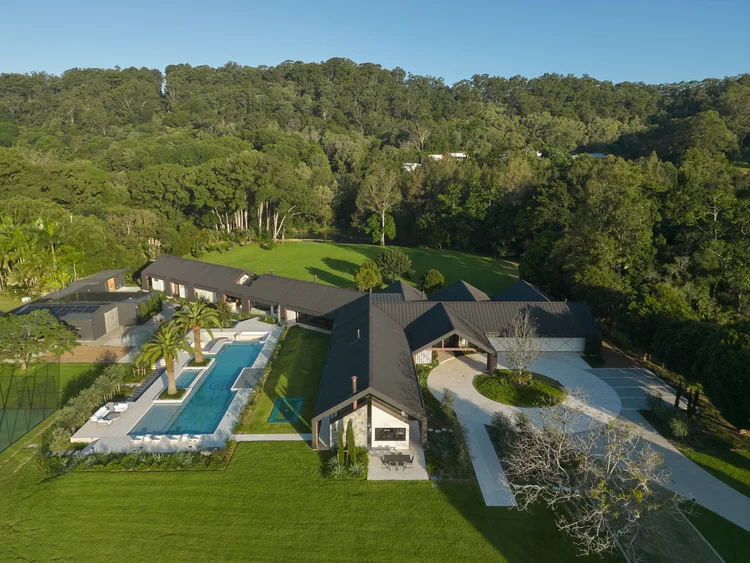
Margot Robbie may have travelled from a Queensland farm to the highest reaches of Hollywood, but a reported $28 million property deal suggests the Gold Coast has never lost its hold on her. The Australian actor and producer is believed to be the mystery buyer of Redwood, a seven-acre Currumbin Valley estate transformed into the …
Continue reading “Margot Robbie Reportedly Behind $28 Million Currumbin Valley Homecoming”
The federal budget has rattled property investors. But the biggest mistake isn’t the tax changes, it’s the conclusion many are drawing from them.
2 min
The recent budget has forced a reckoning for property investors.
Negative gearing now restricted to new residential builds, the CGT discount gone and on paper, the numbers look different.
And many investors are responding by pivoting toward yield, prioritising cash flow over capital growth in a way that property strategists say misses the point entirely.
“The debate has shifted to yield versus growth as if they are opposing forces,” says Abdullah Nouh, founder of Melbourne-based buyers’ agency Mecca Property Group. “But that framing is itself the mistake.”
Nouh, who works with high-net-worth families and investors on long-term acquisition strategy, argues that capital growth remains the primary driver of genuine wealth creation and that the post-budget environment has made quality assets more important, not less.
The numbers make his case plainly. An additional $500 per week in rental income is welcome. A prestige asset appreciating by $1 million over a market cycle is transformative.
These are not equivalent outcomes, and portfolios built around yield at the expense of location and land value tend to generate income while wealth stands largely still.
The more nuanced shift Nouh is seeing among sophisticated investors is a move toward assets where both outcomes can be engineered simultaneously – established homes on substantial land in quality locations, where the existing dwelling can be repositioned, rental returns improved, and the underlying land value compounds independent of what sits on it.
For investors with existing equity, commercial property is also entering the conversation in a more serious way.
Prestige industrial assets, medical centres and long-leased essential retail offer income profiles that residential property in most capital city markets cannot currently match: longer lease terms, tenants covering outgoings, and greater predictability than the residential tenancy cycle.
“The investors who build lasting wealth are rarely the ones who chased yield or growth exclusively,” says Nouh.
“They are the ones who built a strategy they could sustain – one that generated enough income to hold quality assets through multiple cycles while those assets compounded in value.”
The budget has changed the settings. It has not changed the fundamentals.

Formula 1 may be the world’s most glamorous sport, but for Oscar Piastri, it’s also one of the most lucrative. At just 24, Australia’s highest-paid athlete is earning more than US$40 million a year.

BMW has unveiled the Neue Klasse in Munich, marking its biggest investment to date and a new era of electrification, digitalisation and sustainable design.