Future Returns: The Banking Crisis Didn’t Scare Off Alternative Investors

 3 min
3 min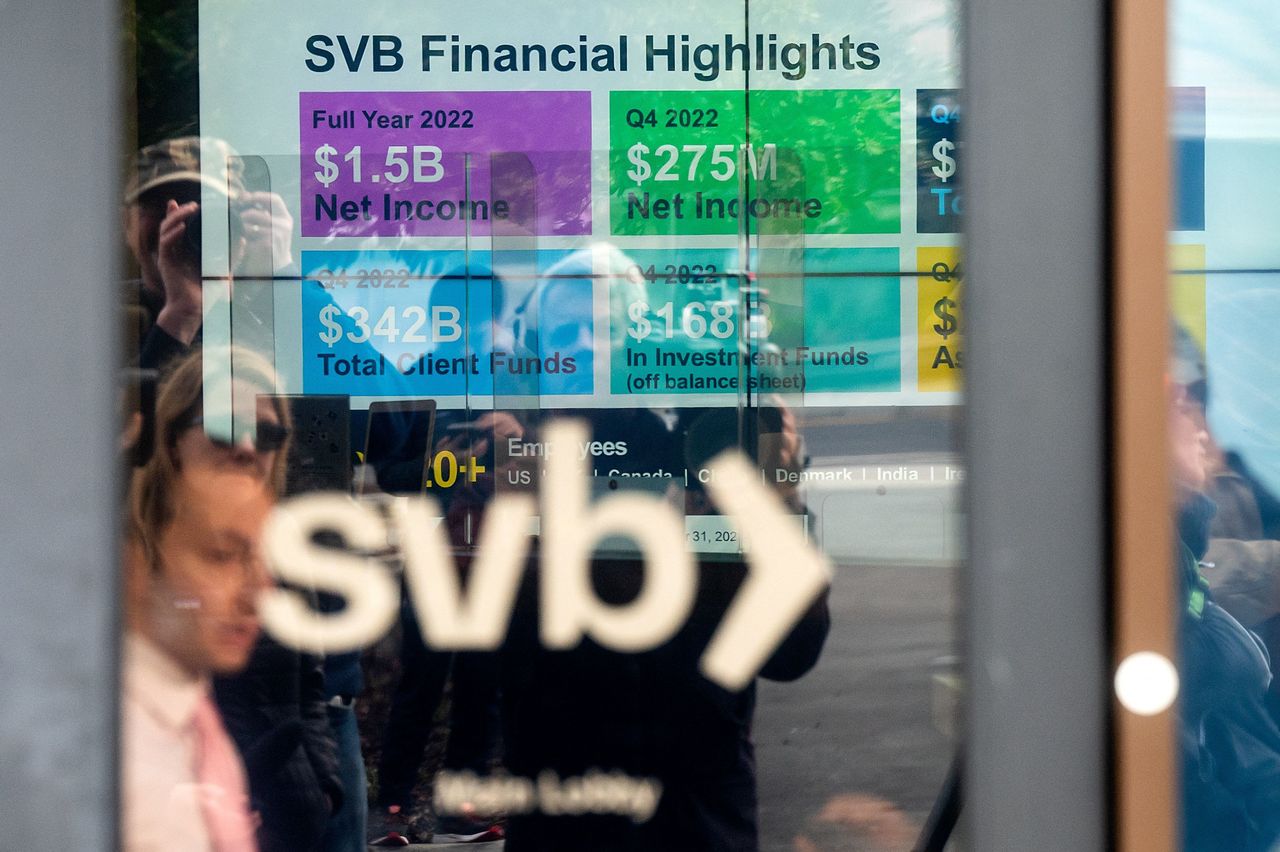
Investing for high-net-worth clients can be a bit of a high-wire act because they can have significant amounts of money tied up in complex alternative investments. When the panic started with the collapse of Silicon Valley Bank in March, wealth manager Tom Ruggie was relieved that none of his clients were directly invested.
“We got lucky there,” says Ruggie, a certified financial planner and author who is based in central Florida. “But when it came to Credit Suisse, we had a little bit of a scare.”
Ruggie’s firms—a family office business called Destiny Wealth Partners and a financial planning firm called Ruggie Wealth Management—did some work with the troubled financial institution on debt obligations. It turned out that all of the contracts were completed, but if Credit Suisse had failed, Ruggie and his clients would have lost a lot of money because the notes would not have been paid back.
Investors who have money in private equity, hedge funds, and direct investments in start-ups are used to taking on a lot of risk and have the financial capacity to absorb it. Ruggie points to an EY study that a third of those with assets above US$250,000 hold some alternatives in their portfolios, including 81% of ultra-high net worth clients with more than US$30 million. Scares don’t happen often, but when they do, “it’s an eye-opening event,” Ruggie says.
Still, rather than run to safety when things turn sour, Ruggie’s clients are more likely to go back and do it again. “They are usually willing to take risks when everyone else is running for cover,” he says. “When you have something come up, like the current banking crisis or the situation in 2008, a lot of people psychologically don’t do well with uncertainty. But the savvy investors, they look at it as an opportunity.”
Here’s where Ruggie says high-net-worth investors want to put their money today.
How Much Risk?
Not all high-net-worth investing is deep in alternatives. Ruggie says he divides client money into three pools: short-term money in fixed income, mid-range money in traditional equity investments like mutual funds and exchange-traded funds, and then long-term money in private investments.
To decide the ratio, he says “it’s a statistical correlation of how much money you have to how much you need and for how long. There’s no cookie-cutter answer.”
Some clients don’t put more than 10% of their net worth into non-traditional alternatives. Ruggie’s personal portfolio is pushing 40% alternatives, he says. Much of that is tied up in sports memorabilia—mostly an extensive baseball card collection—and some collectible wines, along with direct investments in companies.
Non-fungible tokens (NFTs) are a bridge too far—“I personally can’t see the advantage of investing in something like that, and never recommend for a client to do so,” Ruggie says.
As for cryptocurrency, Ruggie has dabbled, but just for the experience. “I wanted to learn,” he says. “I did quite well, but when clients came to us for advice, our guidance was that it’s off our path. Our client base is more concerned about long-term performance than the gambling aspect of investing.”
How Much Capital is Required?
Ruggie says direct investments in companies can start as low as US$25,000. These are the opportunities that are the most interesting to his clients right now, especially technology-based start-ups.
Some clients also take a step back and put their money into private-equity that then pools investments and finds companies worth investing in. Those typically require putting in at least US$250,000 and the purchaser has to be qualified, with a net worth of US$5 million net. Ruggie’s clients also invest in hedge funds, real estate, and collectibles.
Of these investments, hedge funds are the most liquid. There’s usually a lock-in period of a year, but then money can typically be withdrawn with 30-days notice.
Private equity has much less flexibility. “I tell people to basically anticipate no liquidity at all,” Ruggie says. “My mindset on private equity is that this is long-term money.”
The same goes for most direct investments in companies, which aside from the potential to sell stakes on the secondary market, there’s no ability to get cash out unless the company goes public and the shares appreciate.
The Potential Gain?
The main reason for investing in alternatives is that the potential upside of these investments is unlimited.That’s what makes it worth the risk. The other reason is that many high-net-worth clients have money to put on the line.
“What is excess? It’s a correlation between what you have and what you need,” says Ruggie. “Everyone’s definition of rich is different.”
In a year like 2022, advisers like Ruggie have had to go to clients with bad news about losses for the year and say, they may have outperformed the market but still lost 10% or whatever the number. But for Ruggie, that’s a temporary situation with paper losses.
The rest of the speech goes something like this: “It’s my belief—backed up by my personal investments—that what we’re doing with alternatives is going to outperform the market with statistically less risk than the market over time. It will catch up.”
 Copyright 2020, Dow Jones & Company, Inc. All Rights Reserved Worldwide. LEARN MORE


Ophora Tallawong has launched its final release of quality apartments priced under $700,000.

From bushland greens to valley reds, the country’s most awarded designers are proving that the best colour palette was never on a swatch card; it was outside the window all along.


The federal budget has rattled property investors. But the biggest mistake isn’t the tax changes, it’s the conclusion many are drawing from them.
2 min
The recent budget has forced a reckoning for property investors.
Negative gearing now restricted to new residential builds, the CGT discount gone and on paper, the numbers look different.
And many investors are responding by pivoting toward yield, prioritising cash flow over capital growth in a way that property strategists say misses the point entirely.
“The debate has shifted to yield versus growth as if they are opposing forces,” says Abdullah Nouh, founder of Melbourne-based buyers’ agency Mecca Property Group. “But that framing is itself the mistake.”
Nouh, who works with high-net-worth families and investors on long-term acquisition strategy, argues that capital growth remains the primary driver of genuine wealth creation and that the post-budget environment has made quality assets more important, not less.
The numbers make his case plainly. An additional $500 per week in rental income is welcome. A prestige asset appreciating by $1 million over a market cycle is transformative.
These are not equivalent outcomes, and portfolios built around yield at the expense of location and land value tend to generate income while wealth stands largely still.
The more nuanced shift Nouh is seeing among sophisticated investors is a move toward assets where both outcomes can be engineered simultaneously – established homes on substantial land in quality locations, where the existing dwelling can be repositioned, rental returns improved, and the underlying land value compounds independent of what sits on it.
For investors with existing equity, commercial property is also entering the conversation in a more serious way.
Prestige industrial assets, medical centres and long-leased essential retail offer income profiles that residential property in most capital city markets cannot currently match: longer lease terms, tenants covering outgoings, and greater predictability than the residential tenancy cycle.
“The investors who build lasting wealth are rarely the ones who chased yield or growth exclusively,” says Nouh.
“They are the ones who built a strategy they could sustain – one that generated enough income to hold quality assets through multiple cycles while those assets compounded in value.”
The budget has changed the settings. It has not changed the fundamentals.

Rising rates, construction inflation and shrinking investor confidence are pushing Australia deeper into a dangerous housing spiral that monetary policy alone cannot fix.

A bold new era for Australian luxury: MAISON de SABRÉ launches The Palais, a flagship handbag eight years in the making.