Gold Is at a Record High. Why It Is Set to Rise Even More.

 3 min
3 min
Is gold’s strength a flash in the pan or a golden opportunity?
The yellow metal just completed its best two-quarter stretch in eight years on its way to a record high of $2,319 per ounce today.
That performance comes as a bit of a surprise at first blush. After all, gold prices typically rise when interest rates decrease and fall when rates swing higher. Yet recent economic data suggest the Federal Reserve will have to keep interest rates elevated for longer than previously thought to tame inflation.
There has been some good news on inflation. Last Friday, for instance, we learned that the core personal consumption expenditures (PCE) index, which is the Fed’s preferred inflation measure, rose just 2.8% year over year and 0.3% month over month, as expected , in February.
Shorter-term trends paint a more challenging picture for the Fed, however, given that the three-month core PCE trend reflects 3.5% annual growth compared with 2.5% in late 2023.
“The relevant news is that recent inflation data are rising briskly,” writes Michael Lewis, who heads Free Market Inc., an economic consulting firm. This translates into higher rates for longer as the odds of a June rate cut have fallen to 58% from 73% a month ago. Mary Daly, the chief of the San Francisco Federal Reserve, said Tuesday there is “ really no urgency ” to cut rates. Fed Chairman Jerome Powell echoed that sentiment today.
Monday’s ISM manufacturing index report reinforces that narrative . In March, the index delivered its strongest growth since September 2022, rising to 50.3, easily exceeding the expectation of 48.4.
Not surprisingly, on Monday, stocks fell as the yield on the 10-year bond surged to 4.32%. Tuesday we saw more of the same with key stock indexes falling and the 10-year yield rising as high as 4.4% , its highest level in 2024 . Higher rates have been pressuring stocks, bonds, and cryptocurrencies .
Gold is powering higher, however. March 22 is the last day that gold prices fell. The price of gold has risen 9.7% this year while the yield on the 10-year has gained 10.4%.
“Gold is the near-zero yielder that is then showing record demand, despite a world where high nominal yields and carry are still dominant,” wrote Deutsche Bank macro strategist Alan Ruskin in a newsletter last week. “If gold prices won’t go down in an inflated nominal yield world, they can surely go up as the G-10 yield plateau gives way, and yields likely start their descent in” the second half of this year, Ruskin continued.
So what explains gold’s recent rise amid higher rates? Strong demand from China is one factor . The People’s Bank of China went on a buying spree last year, acquiring a net 225 metric tons of gold—the most among all central banks and the country’s biggest expansion of gold reserves since 1977.
With China’s central bank reserves at a record high, its consumers are also actively buying the precious metal, partly due to concerns about their economy and stock market. Among Chinese investors, demand for gold-related ETFs is “booming,” according to The Wall Street Journal, and Chinese imports of gold have surged 51% in the first two months of 2024 compared with the same period last year.
Gold’s more volatile counterpart, silver, surged to a two-year high today, gaining 5% to $27.22 per ounce. Unlike gold, which is at a record high, silver would need to rise more than 80% to reach its 2011 high of near $50.
“The formerly nonchalant silver finally appears ready to join gold’s advance,” John Roque, a technical analyst at 22V Research, wrote in a note, Barron’s reported . “$30 as the first target and then, presuming a breakout, $40 as the second target.” Silver prices are up 12.5% this year.
The entire commodities complex is showing relative strength as the Bloomberg Commodity Index is at its highest level since December . Crude oil is 20.6% higher this year.
Safe-haven demand for gold may increase given fast-rising geopolitical tensions in the Middle East. Moreover, concerns about the national debt are growing louder and more pointed from notable figures across the political spectrum. Unfortunately, there is no indication that politicians will quit pandering to short-term considerations (meaning votes) by making tough choices. As such, expect them to keep playing Kick the Can until one of them slices their foot.
Given all of this, the outlook for gold remains bright . On March 29, Barron’s cited an analysis by economist Charles Gave, founder of Gavekal Research. “The S&P 500 is on the verge of becoming overvalued versus the stock of capital, while gold is almost undervalued against my measure of retained earnings.”
Gave added, “Gold is ‘undervalued’ against the S&P 500 by a hefty -52% and -13% versus its own long-term trend. In contrast, the S&P 500 stands 33% above its own long-term trend level.” Recommending that investors hedge equity exposure with at least 20% of their portfolio in gold, Gave concluded, “At this point my preference based on the relative position of the two reserve assets is to favour gold, followed by equities.”
 Copyright 2020, Dow Jones & Company, Inc. All Rights Reserved Worldwide. LEARN MORE





From making unpopular decisions to learning when to listen, leaders from five businesses reveal what nobody prepared them for — and how running a company has challenged their expectations.

Technology and semiconductor shares fell sharply as investors questioned the debt financing the AI infrastructure boom and confronted higher rates and Chinese competition.
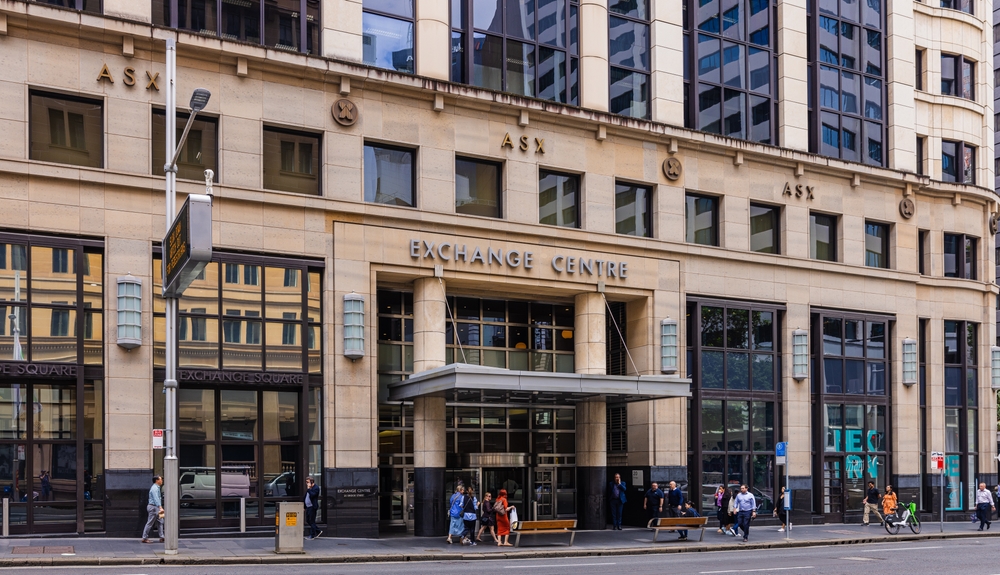
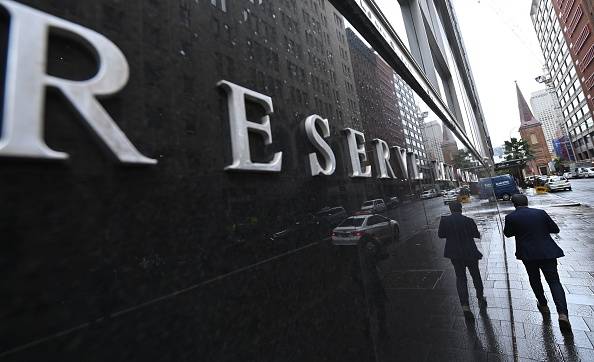
Technology and semiconductor shares fell sharply as investors questioned the debt financing the AI infrastructure boom and confronted higher rates and Chinese competition.
4 minA sharp technology sell-off has exposed a new anxiety on global markets: whether the enormous borrowing behind the artificial-intelligence infrastructure boom can generate sufficient returns as interest rates rise and Chinese competition intensifies.
The artificial-intelligence investment boom has powered technology shares, semiconductor manufacturers and data-centre operators to extraordinary heights. Last week, investors were given a reminder that much of this expansion is being built with borrowed money.
The technology-heavy Nasdaq Composite fell 4.5 per cent over the week ended October 16, its weakest performance since late June. Semiconductor shares suffered an even deeper correction, with the Philadelphia Semiconductor Index losing about 11.4 per cent.
The selling spread quickly through global markets. Micron Technology fell 14.6 per cent over the week, while South Korea’s Samsung Electronics and SK Hynix dropped approximately 18 per cent and 24 per cent respectively.
This was more than a routine bout of profit-taking. Investors were reassessing three interconnected risks: higher interest rates, the rapidly expanding debt burden attached to AI infrastructure and the prospect of stronger competition from Chinese memory-chip manufacturers.
The debt behind the AI build-out
Artificial intelligence requires a physical infrastructure network of enormous scale. Data centres must be built, advanced processors purchased, power supplies secured and cooling systems installed before customers begin generating meaningful revenue from them.
Technology companies are increasingly supplementing their own cash with corporate bonds, syndicated loans, equipment leases, private credit and project-level financing.
JPMorgan describes the emerging funding model as a combination of conventional corporate borrowing and project finance tied to individual data-centre assets. In Australia, the Reserve Bank estimates that syndicated loans accounted for approximately three-quarters of data-centre financing during 2025 and 2026 to date.
The numbers are becoming large enough to affect broader credit markets. The Federal Reserve Bank of Dallas has cited Wall Street estimates suggesting AI-related investment-grade bond issuance could approach US$300 billion in 2026 alone.
That borrowing is not automatically problematic. Debt can be an efficient way to finance long-lived infrastructure when future revenue is sufficiently predictable. The concern is that AI technology, customer demand and computing economics are changing much faster than the repayment schedules attached to the assets.
A data centre financed today may carry debt for years. Investors must therefore make assumptions about future utilisation rates, electricity prices, chip performance, customer concentration and the amount businesses will ultimately pay for AI computing.
When interest rates rise, those assumptions become less forgiving.
Inflation changes the calculation
September’s US inflation data intensified the pressure. Consumer prices increased 3.7 per cent over the year, ahead of market expectations and up from 3.4 per cent in August.
The hotter reading reduced confidence that interest rates would fall quickly and pushed bond yields higher. That matters particularly for companies whose valuations depend on profits expected well into the future, as well as highly leveraged infrastructure operators that may need to refinance.
CoreWeave has emerged as a closely watched test case. The specialist cloud-computing company has accumulated substantial debt and lease obligations to build AI capacity, while relying on a concentrated group of large technology customers.
Its shares fell sharply during the sell-off, while the cost of insuring its debt against default climbed. CoreWeave has argued that its contracted backlog more than covers its obligations and that financial markets do not always understand its business model. Nevertheless, its securities have become a proxy for investor confidence in debt-funded AI infrastructure.
Oracle, another major investor in AI computing capacity, fell 8.8 per cent in Friday trading, while CoreWeave dropped 15.5 per cent.
The question is shifting from how much AI infrastructure can be built to how profitably it can be operated.
China adds another source of pressure
Interest rates were not the only catalyst. Reports of advances by Chinese memory-chip producer ChangXin Memory Technologies raised concerns that lower-cost Chinese products could increase competition across the global semiconductor industry.
Memory chips are essential to AI systems, but the industry is historically cyclical. Periods of tight supply and high pricing can encourage rapid investment, eventually producing oversupply and falling margins.
The prospect of a well-funded Chinese competitor expanding its technological capabilities unsettled investors in Samsung, SK Hynix and Micron. It also demonstrated that AI-related demand does not insulate chipmakers from conventional competitive pressures.
That combination—slower rate cuts, more expensive financing and potentially cheaper supply—challenged the assumption that every company exposed to AI would enjoy continually expanding margins.
A reset rather than the end of the boom
The sell-off does not establish that the AI boom is ending. Demand for computing power remains strong, the largest technology companies continue to generate formidable cash flows and many infrastructure projects are backed by long-term customer contracts.
What has changed is the market’s willingness to overlook the price and financing structure of that growth.
The most resilient companies are likely to be those able to fund investment from operating cash flow, secure long-duration customers and demonstrate that new capacity will earn returns comfortably above its financing costs.
More speculative operators may face greater scrutiny, particularly where debt is expensive, customers are concentrated or expected revenue depends on demand that has not yet materialised.
For Australian investors, the lesson extends beyond US technology shares. Local data-centre operators, infrastructure funds, electricity suppliers and property groups are increasingly exposed to the same investment cycle.
Artificial intelligence may remain one of the defining growth themes of the decade. But last week’s correction showed that enthusiasm for the technology does not eliminate financial discipline.
The next stage of the AI boom will be judged not only by computing power, model performance or demand for chips, but by something more traditional: whether the assets being financed can generate enough cash to repay the money borrowed to build them.
Fact box
Nasdaq Composite: Down 4.5 per cent for the week ended October 16, 2026
Philadelphia Semiconductor Index: Down approximately 11.4 per cent
Micron Technology: Down approximately 14.6 per cent
Samsung Electronics: Down approximately 18 per cent
SK Hynix: Down approximately 24 per cent
US September inflation: 3.7 per cent annually
Estimated 2026 AI-related investment-grade issuance: Approximately US$300 billion

Exclusive eco-conscious lodges are attracting wealthy travellers seeking immersive experiences that prioritise conservation, community and restraint over excess.

From warmer neutrals to tactile finishes, Australian homes are moving away from stark minimalism and towards spaces that feel more human.