Inflation Victory Is Proving Elusive, Challenging Central Banks and Markets
In the U.S. and Europe, underlying inflation has stopped falling or edged higher recently, weakening the case for rate cuts

 4 min
4 min
Inflation is proving stickier than expected in the U.S. and Europe, creating a headache for central bankers and sowing doubts on whether investors are too optimistic about the world economy.
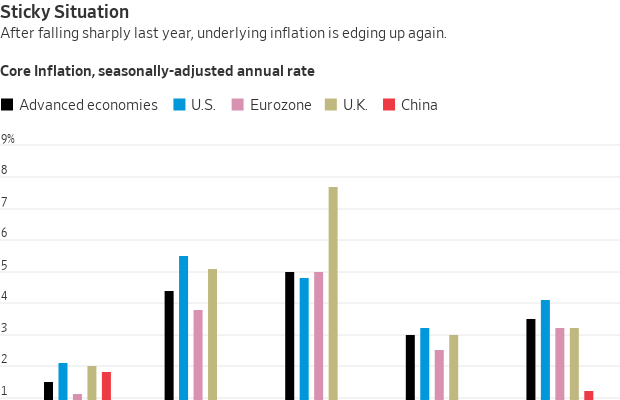
The decline in inflation from highs of around 9% to 10% across advanced economies in 2022 represent the easy gains, as supply-chain blockages eased and commodity prices, especially for energy, normalised.
The “last mile” is proving tougher . Underlying inflation, which excludes volatile food and energy prices, slowed to 3% in the second half of last year across advanced economies but has since moved up to 3.5%, according to JP Morgan estimates.
That is forcing investors to rethink bets that inflation would steadily decline to central banks’ targets, generally around 2%. There are even concerns it could surge again, mirroring the second wave that characterised the high inflation of the 1970s.
Economists’ and central banks’ forecasts of sustained falling inflation depend on “strong gravitational forces that are not yet validated in global labor costs, short-term expectations, or in recent signals from commodity markets,” JP Morgan wrote in a note. Services inflation remains elevated while goods prices, which had fallen last year, are now moving higher, it noted.
Waiting on the last mile
Central bankers say they expected the last mile of falling inflation to be bumpy. Yet they are also signalling their willingness to wait before cutting interest rates. Fewer, or no, rate cuts would have sweeping repercussions for the global economy and markets, whose recent rally began after a narrow majority of Federal Reserve officials recently reaffirmed projections to cut interest rates three times this year.
On Friday, the U.S. Commerce Department reported that the price index of personal-consumption expenditures, the Fed’s preferred indicator of inflation, rose a relatively tame 2.5% in the 12 months through February, up modestly from 2.4% in January. Beneath the surface, the trend was less comforting. The index excluding food and energy climbed by 3.5% on an annualised basis in the three months through February, up from around 2% late last year.
“These shorter-term inflation measures are now telling me that progress has slowed and may have stalled,” Fed governor Christopher Waller said in a speech Thursday, before the latest inflation data.
“In my view, it is appropriate to reduce the overall number of rate cuts or push them further into the future,” Waller said.
Fed Chair Jerome Powell struck a more balanced note Friday, saying inflation is on a sometimes bumpy path toward 2%, and strong economic growth allows policymakers to wait. “Is progress on inflation going to slow for more than two months?…We’re just going to have to let the data tell us that,” Powell said in an interview at the San Francisco Fed.
Joachim Nagel , president of Germany’s Bundesbank and a member of the European Central Bank’s rate-setting committee said in late February that underlying inflation in the eurozone was still 2 percentage points higher than its 1999 to 2019 average.
“If we reduce interest rates too early or too sharply, we run the risk of missing our target,” and might need to raise interest rates again, he said. He highlighted a recent International Monetary Fund report that found four out of every 10 inflation shocks since the 1970s had yet to be overcome even after five years.
In Italy, underlying inflation climbed to 2.4% in March from 2.3% the previous month, according to data published Friday. French headline inflation cooled to 2.3% in March, but services prices remained sticky, rising by 3% from a year earlier.
Why is inflation proving stubborn?
Despite the sharp interest-rate increases of the past two years, economic growth is resilient, especially in the U.S. The Atlanta Fed said Friday its real-time indicator of first quarter U.S. economic growth ticked up to 2.3% from 2.1%. Consumer spending, adjusted for inflation, increased by around 5% on an annual basis in February, the Commerce Department said.
“The unexpected strength of real consumption” means “there is still no rush to cut interest rates,” said Paul Ashworth , an economist with Capital Economics.
While Europe’s growth has stalled since late 2022, recent business surveys suggest the outlook is brightening. Meanwhile, job creation has been strong on both sides of the Atlantic, and wage growth remains high, partly reflecting tight labor markets. Wages are an important input to services-price inflation in the eurozone, which has been running at a 4% annual rate since November.
March inflation data for the entire eurozone will be published on Wednesday. ECB officials have indicated they could start to cut interest rates in June from the current 4% level, while the subsequent pace of cuts after that is unclear.
Central banks may be part of the problem
Central banks themselves may be inadvertently adding to inflation pressure. By signalling a pivot toward interest-rate cuts last fall, they pushed global borrowing costs down and asset prices up, supporting spending.
Some factors favour inflation declining further. In both the U.S. and Europe, a surge of immigration could help keep a lid on wage increases.
The U.S.—but not Europe—is also seeing big increases in productivity, that is output per worker, which helps to offset high wage growth. It is unclear, however, how long that will last. The pandemic might have changed how Americans work and use technology, but “once we have made those changes, they’re done, so I don’t see this as a driver of sustained productivity growth,” the Fed’s Waller said.
Meanwhile, oil prices have risen recently, which could push up headline inflation.
To offset a slumping property market, China has dramatically boosted manufacturing capacity and exports, which have weighed on global goods inflation. But its export prices have recently started to increase, according to JP Morgan.
If central banks react to stubborn inflation by backing away from rate cuts, that would put pressure on both heavily indebted governments and employers. That could test central banks’ will to finish the last mile and push inflation all the way to target.
Higher government spending on defence and green energy, and geopolitical tensions that crimp global trade, are likely to pressure central banks to tolerate higher inflation over the coming years, according to a Brookings Institution paper published in March.
“A strengthening of central bank independence combined with a more credible public debt policy is likely needed,” said the paper, by economist Kenneth Rogoff of Harvard University and three co-authors.
 Copyright 2020, Dow Jones & Company, Inc. All Rights Reserved Worldwide. LEARN MORE


Ophora Tallawong has launched its final release of quality apartments priced under $700,000.

From bushland greens to valley reds, the country’s most awarded designers are proving that the best colour palette was never on a swatch card; it was outside the window all along.


The federal budget has rattled property investors. But the biggest mistake isn’t the tax changes, it’s the conclusion many are drawing from them.
2 min
The recent budget has forced a reckoning for property investors.
Negative gearing now restricted to new residential builds, the CGT discount gone and on paper, the numbers look different.
And many investors are responding by pivoting toward yield, prioritising cash flow over capital growth in a way that property strategists say misses the point entirely.
“The debate has shifted to yield versus growth as if they are opposing forces,” says Abdullah Nouh, founder of Melbourne-based buyers’ agency Mecca Property Group. “But that framing is itself the mistake.”
Nouh, who works with high-net-worth families and investors on long-term acquisition strategy, argues that capital growth remains the primary driver of genuine wealth creation and that the post-budget environment has made quality assets more important, not less.
The numbers make his case plainly. An additional $500 per week in rental income is welcome. A prestige asset appreciating by $1 million over a market cycle is transformative.
These are not equivalent outcomes, and portfolios built around yield at the expense of location and land value tend to generate income while wealth stands largely still.
The more nuanced shift Nouh is seeing among sophisticated investors is a move toward assets where both outcomes can be engineered simultaneously – established homes on substantial land in quality locations, where the existing dwelling can be repositioned, rental returns improved, and the underlying land value compounds independent of what sits on it.
For investors with existing equity, commercial property is also entering the conversation in a more serious way.
Prestige industrial assets, medical centres and long-leased essential retail offer income profiles that residential property in most capital city markets cannot currently match: longer lease terms, tenants covering outgoings, and greater predictability than the residential tenancy cycle.
“The investors who build lasting wealth are rarely the ones who chased yield or growth exclusively,” says Nouh.
“They are the ones who built a strategy they could sustain – one that generated enough income to hold quality assets through multiple cycles while those assets compounded in value.”
The budget has changed the settings. It has not changed the fundamentals.

Limited to 630 units, Lamborghini’s latest Urus Capsule pushes personalisation further than ever, blending hybrid performance with over 70 bespoke design combinations.

On October 2, acclaimed chef Dan Arnold will host an exclusive evening, unveiling a Michelin-inspired menu in a rare masterclass of food, storytelling and flavour.