Investments in Solar Power Eclipse Oil for First Time
Government spending, including Biden’s Inflation Reduction Act, has helped drive a gap between clean-energy spending and fossil-fuel investments

 3 min
3 min
Investments in solar power are on course to overtake spending on oil production for the first time, the foremost example of a widening gap between renewable-energy funding and stagnating fossil-fuel industries, according to the head of the International Energy Agency.
More than $1 billion a day is expected to be invested in solar power this year, which is higher than total spending expected for new upstream oil projects, the IEA said in its annual World Energy Investment report.
Spending on so-called clean-energy projects—which includes renewable energy, electric vehicles, low-carbon hydrogen and battery storage, among other things—is rising at a “striking” rate and vastly outpacing spending on traditional fossil fuels, Fatih Birol, the IEA’s executive director said in an interview. The figures should raise hopes that worldwide efforts to keep global warming within manageable levels are heading in the right direction, he said.
Birol pointed to a “powerful alignment of major factors,” driving clean-energy spending higher, while spending on oil and other fossil fuels remains subdued. This includes mushrooming government spending aimed at driving adherence to global climate targets such as President Biden’s Inflation Reduction Act.
“A new clean global energy economy is emerging,” Birol told The Wall Street Journal. “There has been a substantial increase in a short period of time—I would consider this to be a dramatic shift.”
A total of $2.8 trillion will be invested in global energy supplies this year, of which $1.7 trillion, or more than 60% will go toward clean-energy projects. The figure marks a sharp increase from previous years and highlights the growing divergence between clean-energy spending and traditional fossil-fuel industries such as oil, gas and coal. For every $1 spent on fossil-fuel energy this year, $1.70 will be invested into clean-energy technologies compared with five years ago when the spending between the two was broadly equal, the IEA said.
While investments in clean energy have been strong, they haven’t been evenly split. Ninety percent of the growth in clean-energy spending occurs in the developed world and China, the IEA said. Developing nations have been slower to embrace renewable-energy sources, put off by the high upfront price tag of emerging technologies and a shortage of affordable financing. They are often financially unable to dole out large sums on subsidies and state backing, as the U.S., European Union and China have done.
The Covid-19 pandemic appears to have marked a turning point for global energy spending, the IEA’s data shows. The powerful economic rebound that followed the end of lockdown measures across most of the globe helped prompt the divergence between spending on clean energy and fossil fuels.
The energy crisis that followed Russia’s invasion of Ukraine last year has further driven the trend. Soaring oil and gas prices after the war began made emerging green-energy technologies comparatively more affordable. While clean-energy technologies have recently been hit by some inflation, their costs remain sharply below their historic levels. The war also heightened attention on energy security, with many Western nations, particularly in Europe, seeking to remove Russian fossil fuels from their economies altogether, often replacing them with renewables.
While clean-energy spending has boomed, spending on fossil fuels has been tepid. Despite earning record profits from soaring oil and gas prices, energy companies have shown a reluctance to invest in new fossil-fuel projects when demand for them appears to be approaching its zenith.
Energy forecasters are split on when demand for fossil fuels will peak, but most have set out a timeline within the first half of the century. The IEA has said peak fossil-fuel demand could come as soon as this decade. The Organization of the Petroleum Exporting Countries, a cartel of the world’s largest oil-producing nations, has said demand for crude oil could peak in developed nations in the mid-2020s, but that demand in the developing world will continue to grow until at least 2045.
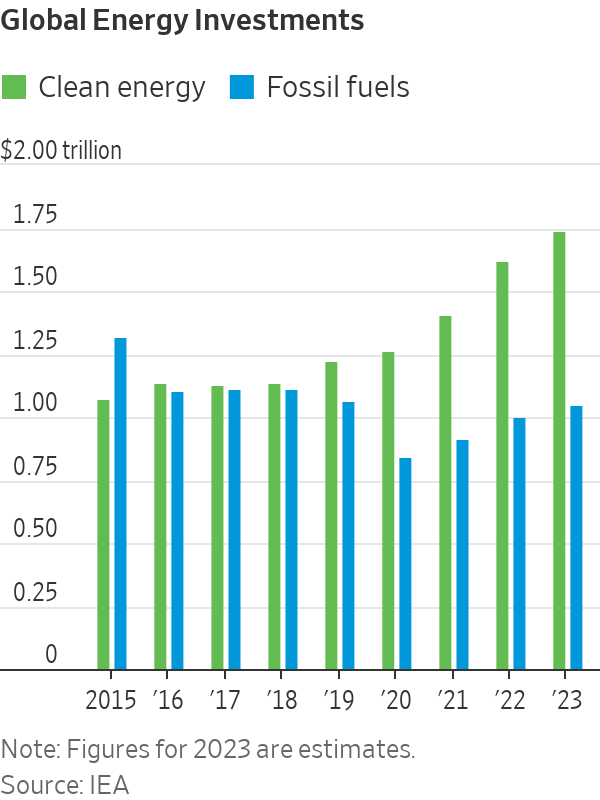
Investments in clean energy and fossil fuels were largely neck-and-neck in the years leading up to the pandemic, but have diverged sharply since. While spending on fossil fuels has edged higher over the last three years, it remains lower than pre pandemic levels, the IEA said.
Only large state-owned national oil companies in the Middle East are expected to spend more on oil production this year than in 2022. Almost half of the extra spending will be absorbed by cost inflation, the IEA said. Last year marked the first one where oil-and-gas companies spent more on debt repayments, dividends and share buybacks than they did on capital expenditure.
The lack of spending on fossil fuels raises a question mark around rising prices. Oil markets are already tight and are expected to tighten further as demand grows following the pandemic, with seemingly few sources of new supply to compensate. Higher oil prices could further encourage the shift toward clean-energy sources.
“If there is not enough investment globally to reduce the oil demand growth and there is no investment at the same time [in] upstream oil we may see further volatility in global oil prices,” Birol said.
 Copyright 2020, Dow Jones & Company, Inc. All Rights Reserved Worldwide. LEARN MORE


Ophora Tallawong has launched its final release of quality apartments priced under $700,000.

From bushland greens to valley reds, the country’s most awarded designers are proving that the best colour palette was never on a swatch card; it was outside the window all along.


The federal budget has rattled property investors. But the biggest mistake isn’t the tax changes, it’s the conclusion many are drawing from them.
2 min
The recent budget has forced a reckoning for property investors.
Negative gearing now restricted to new residential builds, the CGT discount gone and on paper, the numbers look different.
And many investors are responding by pivoting toward yield, prioritising cash flow over capital growth in a way that property strategists say misses the point entirely.
“The debate has shifted to yield versus growth as if they are opposing forces,” says Abdullah Nouh, founder of Melbourne-based buyers’ agency Mecca Property Group. “But that framing is itself the mistake.”
Nouh, who works with high-net-worth families and investors on long-term acquisition strategy, argues that capital growth remains the primary driver of genuine wealth creation and that the post-budget environment has made quality assets more important, not less.
The numbers make his case plainly. An additional $500 per week in rental income is welcome. A prestige asset appreciating by $1 million over a market cycle is transformative.
These are not equivalent outcomes, and portfolios built around yield at the expense of location and land value tend to generate income while wealth stands largely still.
The more nuanced shift Nouh is seeing among sophisticated investors is a move toward assets where both outcomes can be engineered simultaneously – established homes on substantial land in quality locations, where the existing dwelling can be repositioned, rental returns improved, and the underlying land value compounds independent of what sits on it.
For investors with existing equity, commercial property is also entering the conversation in a more serious way.
Prestige industrial assets, medical centres and long-leased essential retail offer income profiles that residential property in most capital city markets cannot currently match: longer lease terms, tenants covering outgoings, and greater predictability than the residential tenancy cycle.
“The investors who build lasting wealth are rarely the ones who chased yield or growth exclusively,” says Nouh.
“They are the ones who built a strategy they could sustain – one that generated enough income to hold quality assets through multiple cycles while those assets compounded in value.”
The budget has changed the settings. It has not changed the fundamentals.

Two coming 2027 models – the first of the “Neue Klasse” cars coming to the U.S. early next year – have been revealed.

A haven for hedge-fund titans and Hollywood grandees, Greenwich is one of the world’s most expensive residential enclaves, where eye-watering prices meet unapologetic grandeur.