Investors Have Cooled on Hydrogen. A Second Wave Is Coming.

 5 min
5 min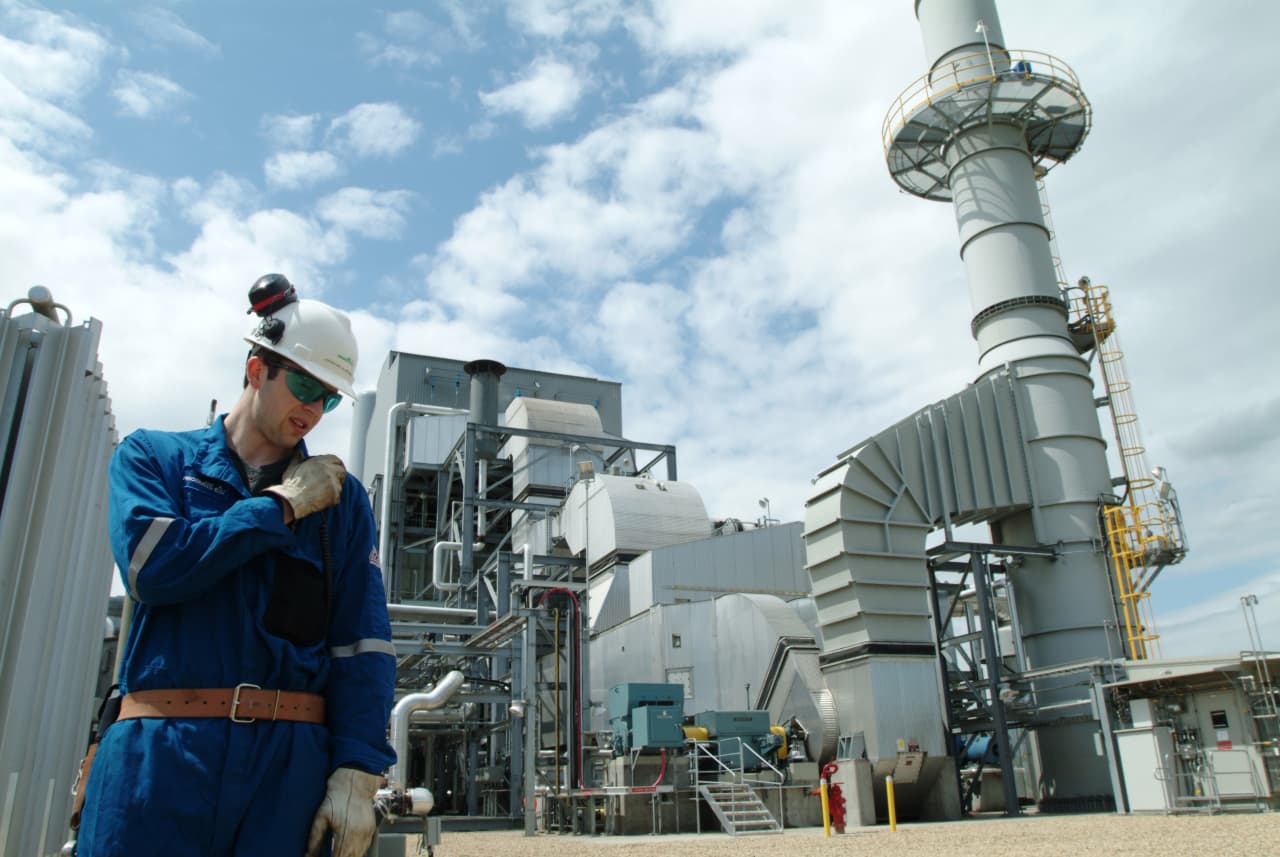
Investors may want to give hydrogen a second look, but they’ll need to be patient.
There’s not a lot of love for the fuel on Wall Street. The Global X Hydrogen ETF is down 81% from its high in 2021, and other hydrogen stocks are well below their peaks.
Skeptics say the cleanest hydrogen is too pricey and still far away from becoming part of a viable marketplace. The government is still sorting out regulation and industry incentives. New infrastructure will be required, and it isn’t clear there will be enough customers once it’s built.
But even as investor enthusiasm faded, a raft of companies have been quietly exploring hydrogen as a clean-burning fuel that can be a building block in the energy transition. There are numerous corporate projects in development that could help propel the growth of a hydrogen economy and drive profits in the future. The Department of Energy is investing $8 billion in promoting clean hydrogen, with the creation of seven hydrogen hubs around the U.S. within the decade.
Many energy and petrochemical companies are studying or have hydrogen projects in the works as a way to decarbonise. One reason is that hydrogen is used in the refining process, and cleaner hydrogen could be used in industrial processes. Hydrogen can be turned into ammonia and is used in fertiliser. In its next wave, hydrogen could be widely used in industrial applications like steel making and for fuel in ships and aircraft.
Supporters believe all the money pouring in now will help bring costs down as hydrogen projects scale. Investors may want to look at traditional energy and industrial companies that are currently working on hydrogen projects as a way to play the long-term growth of a hydrogen market.
“All these companies…have decarbonisation aspirations,” said Marc Bianchi, managing director at TD Cowen. There’s a meaningful opportunity for companies that are already using thousands of tons of hydrogen a day to switch from dirtier to cleaner sources.
The U.S. uses about 10 million tons of hydrogen a year for applications such as refining and fertiliser. Hydrogen demand was about 2% of global energy consumption in 2020 and could grow to 20% to 30% in a net-zero economy, according to S&P Global Commodity Insights.
Hydrogen gas is colourless, but industry shorthand assigns colours based on how the fuel is produced. Green hydrogen is the most desirable. Electricity generated from solar or wind is used to split hydrogen from water molecules and produces no carbon byproducts. Blue hydrogen is made by using natural gas along with capture and storage technologies to limit CO2. Gray hydrogen is made with natural gas or methane and generates carbon dioxide.
S&P Global Commodity Insights projects the cleanest hydrogen, even with incentives, would be about three times more costly in parts of the country where renewable energy is more expensive, like the Northeast. In the best case, green hydrogen produced in Texas, using proposed tax incentives and credits, could be as low as $1 per kilogram, slightly less than the $1.3 per kilogram cost of gray hydrogen. In Europe, green hydrogen is $6 to $9 per kilogram.
The energy industry, however, is waiting to see the final structure of U.S. tax credits granted to clean hydrogen under the Inflation Reduction Act. The Internal Revenue Service issued a draft guidance on implementation.
It was viewed as too restrictive by many in the industry, and some industry executives say it put a chill on activity while they wait to see how deep incentives will be for their proposed processes. The comment period has just ended.
“Anyone in power generation wants to talk about hydrogen,” said Richard Voorberg, president of North America for Siemens Energy . “Now, we’ve seen that plateau over the last little while, meaning months. Everyone was excited about [the Inflation Reduction Act], but the guidance that came out Dec. 22 had people scratching their heads.”
Ernest Moniz, a former energy secretary, heads the consortium formed to organise a market for clean hydrogen, called the Hydrogen Demand Initiative. Moniz said recently that the guidance presented by the IRS was too narrow and could slow the industry’s growth if not changed.
“The philosophy has been to require upfront decarbonisation of the electrons that you’re supposed to be using for the electrolysis of water, and the fear—and I certainly fear it—is this will significantly inhibit the near-term demand creation,” Moniz said. “We might end up with a very low carbon grid, but a hydrogen market that’s way behind where it should be at that time.” He added that he’s watching for how the IRS adjusts its plans for the tax credits.
Investors looking at companies with hydrogen projects need to be sure the value is there for the company’s traditional businesses. Analysts say valuations don’t appear to reflect potential for hydrogen, even if some had in the past.
Hydrogen was once the “shiniest new toy” for investors, but disillusionment has set in, said Timm Schneider, CEO of Schneider Capital Group. “Not one investor has asked me about hydrogen at any company, like Chevron or Exxon, that has a hydrogen project, over the past 12 months,” he said.
One way to invest in the transition is through industrial gas companies. S&P Global is projecting that Air Products and Chemicals will be the leading industrial gas producer of hydrogen, in the amount of 5.2 million metric tons by 2030. Exxon Mobil is positioned to be the largest producer among oil-and-gas companies, with 1.5 MMT, S&P Global said.
Air Products CEO Seifi Ghasemi, speaking at the CERAWeek by S&P Global conference last month, said his company is currently the largest producer of grey hydrogen globally. He wants to be the leader in green and blue. The company began producing grey hydrogen at the request of the U.S. government in the 1950s for use in the space program.
Ghasemi said the company has two major projects in development. One is in northern Saudi Arabia, where the company will use wind and solar with its partners to create 650 tons of hydrogen a day. That project, he said, IS “30 times bigger than anything that exists today.”
Air Products has been collaborating with Baker Hughes , an energy services and technology company that has developed turbines and compressors. Baker is working on the hydrogen project in Saudi Arabia and the two have another project under way in Alberta, Canada that is expected to be operational next year. “Baker Hughes is interesting. It is supplying a turbine to that project in Alberta that’s going to run on 100% hydrogen. That’s been a bit of a challenge for the industry, to burn hydrogen in a turbine,” said Bianchi. Baker Hughes, he said, was the first to succeed.
The demand for hydrogen is still uncertain and the market is nascent. The anticipated supply of hydrogen is well ahead of demand, Enverus Intelligence Research said in a report last week. Only 30% of the U.S. projects expected by 2030 have disclosed customers.
But there was a bright note in the Enverus report. European Union decarbonisation targets could mean U.S. producers could find a significant export market.
Exports are what helped turn the U.S. into the leading producer of oil and gas. The energy industry might follow that playbook again with hydrogen.
 Copyright 2020, Dow Jones & Company, Inc. All Rights Reserved Worldwide. LEARN MORE





From making unpopular decisions to learning when to listen, leaders from five businesses reveal what nobody prepared them for — and how running a company has challenged their expectations.

Technology and semiconductor shares fell sharply as investors questioned the debt financing the AI infrastructure boom and confronted higher rates and Chinese competition.


Technology and semiconductor shares fell sharply as investors questioned the debt financing the AI infrastructure boom and confronted higher rates and Chinese competition.
4 minA sharp technology sell-off has exposed a new anxiety on global markets: whether the enormous borrowing behind the artificial-intelligence infrastructure boom can generate sufficient returns as interest rates rise and Chinese competition intensifies.
The artificial-intelligence investment boom has powered technology shares, semiconductor manufacturers and data-centre operators to extraordinary heights. Last week, investors were given a reminder that much of this expansion is being built with borrowed money.
The technology-heavy Nasdaq Composite fell 4.5 per cent over the week ended October 16, its weakest performance since late June. Semiconductor shares suffered an even deeper correction, with the Philadelphia Semiconductor Index losing about 11.4 per cent.
The selling spread quickly through global markets. Micron Technology fell 14.6 per cent over the week, while South Korea’s Samsung Electronics and SK Hynix dropped approximately 18 per cent and 24 per cent respectively.
This was more than a routine bout of profit-taking. Investors were reassessing three interconnected risks: higher interest rates, the rapidly expanding debt burden attached to AI infrastructure and the prospect of stronger competition from Chinese memory-chip manufacturers.
The debt behind the AI build-out
Artificial intelligence requires a physical infrastructure network of enormous scale. Data centres must be built, advanced processors purchased, power supplies secured and cooling systems installed before customers begin generating meaningful revenue from them.
Technology companies are increasingly supplementing their own cash with corporate bonds, syndicated loans, equipment leases, private credit and project-level financing.
JPMorgan describes the emerging funding model as a combination of conventional corporate borrowing and project finance tied to individual data-centre assets. In Australia, the Reserve Bank estimates that syndicated loans accounted for approximately three-quarters of data-centre financing during 2025 and 2026 to date.
The numbers are becoming large enough to affect broader credit markets. The Federal Reserve Bank of Dallas has cited Wall Street estimates suggesting AI-related investment-grade bond issuance could approach US$300 billion in 2026 alone.
That borrowing is not automatically problematic. Debt can be an efficient way to finance long-lived infrastructure when future revenue is sufficiently predictable. The concern is that AI technology, customer demand and computing economics are changing much faster than the repayment schedules attached to the assets.
A data centre financed today may carry debt for years. Investors must therefore make assumptions about future utilisation rates, electricity prices, chip performance, customer concentration and the amount businesses will ultimately pay for AI computing.
When interest rates rise, those assumptions become less forgiving.
Inflation changes the calculation
September’s US inflation data intensified the pressure. Consumer prices increased 3.7 per cent over the year, ahead of market expectations and up from 3.4 per cent in August.
The hotter reading reduced confidence that interest rates would fall quickly and pushed bond yields higher. That matters particularly for companies whose valuations depend on profits expected well into the future, as well as highly leveraged infrastructure operators that may need to refinance.
CoreWeave has emerged as a closely watched test case. The specialist cloud-computing company has accumulated substantial debt and lease obligations to build AI capacity, while relying on a concentrated group of large technology customers.
Its shares fell sharply during the sell-off, while the cost of insuring its debt against default climbed. CoreWeave has argued that its contracted backlog more than covers its obligations and that financial markets do not always understand its business model. Nevertheless, its securities have become a proxy for investor confidence in debt-funded AI infrastructure.
Oracle, another major investor in AI computing capacity, fell 8.8 per cent in Friday trading, while CoreWeave dropped 15.5 per cent.
The question is shifting from how much AI infrastructure can be built to how profitably it can be operated.
China adds another source of pressure
Interest rates were not the only catalyst. Reports of advances by Chinese memory-chip producer ChangXin Memory Technologies raised concerns that lower-cost Chinese products could increase competition across the global semiconductor industry.
Memory chips are essential to AI systems, but the industry is historically cyclical. Periods of tight supply and high pricing can encourage rapid investment, eventually producing oversupply and falling margins.
The prospect of a well-funded Chinese competitor expanding its technological capabilities unsettled investors in Samsung, SK Hynix and Micron. It also demonstrated that AI-related demand does not insulate chipmakers from conventional competitive pressures.
That combination—slower rate cuts, more expensive financing and potentially cheaper supply—challenged the assumption that every company exposed to AI would enjoy continually expanding margins.
A reset rather than the end of the boom
The sell-off does not establish that the AI boom is ending. Demand for computing power remains strong, the largest technology companies continue to generate formidable cash flows and many infrastructure projects are backed by long-term customer contracts.
What has changed is the market’s willingness to overlook the price and financing structure of that growth.
The most resilient companies are likely to be those able to fund investment from operating cash flow, secure long-duration customers and demonstrate that new capacity will earn returns comfortably above its financing costs.
More speculative operators may face greater scrutiny, particularly where debt is expensive, customers are concentrated or expected revenue depends on demand that has not yet materialised.
For Australian investors, the lesson extends beyond US technology shares. Local data-centre operators, infrastructure funds, electricity suppliers and property groups are increasingly exposed to the same investment cycle.
Artificial intelligence may remain one of the defining growth themes of the decade. But last week’s correction showed that enthusiasm for the technology does not eliminate financial discipline.
The next stage of the AI boom will be judged not only by computing power, model performance or demand for chips, but by something more traditional: whether the assets being financed can generate enough cash to repay the money borrowed to build them.
Fact box
Nasdaq Composite: Down 4.5 per cent for the week ended October 16, 2026
Philadelphia Semiconductor Index: Down approximately 11.4 per cent
Micron Technology: Down approximately 14.6 per cent
Samsung Electronics: Down approximately 18 per cent
SK Hynix: Down approximately 24 per cent
US September inflation: 3.7 per cent annually
Estimated 2026 AI-related investment-grade issuance: Approximately US$300 billion

International AI strategist Justin Kabbani will headline the Kanebridge Property Summit in Sydney on June 18, with tickets selling fast.

Australian shares fell on Thursday as Wall Street weakness, rising oil and persistent rate concerns weighed on most of the market. The S&P/ASX 200 declined 0.72 per cent to 8,702. The All Ordinaries lost 0.66 per cent to finish at 8,897. Mining stocks were hit particularly hard, while real estate also dragged on the index. …
Continue reading “ASX falls 0.7 per cent as miners and property stocks retreat”