Is This 1987 All Over Again? What’s Driving the Market Meltdown?
Past routs offer lessons after Black Monday Morning

 4 min
4 min")
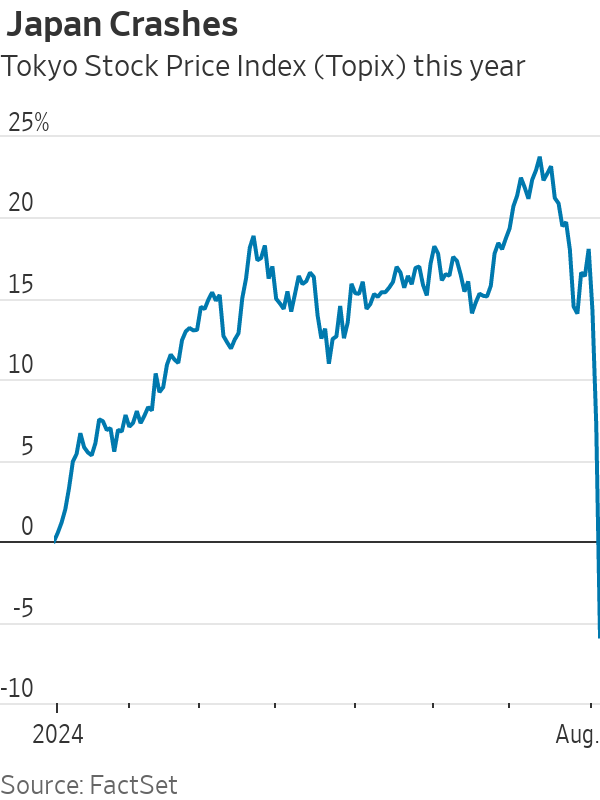
Financial markets are supposed to capture the wisdom of the crowd, but on Monday the crowd ran in all directions waving its hands in the air screaming. Japan’s stock market fell the most in 37 years with a 12% plunge that wiped out all its gains for the year, while in the U.S. the VIX index of implied stock volatility briefly had its biggest rise ever. Panic hit.
The selloff was triggered by Friday’s jobs data prompting a sudden switch in the economic narrative from soft landing to hard landing. Add to the mix a period of deflating hype about artificial intelligence and a Bank of Japan rate rise designed to strengthen the yen. News that Warren Buffett’s Berkshire Hathaway had sold half its Apple shares and boosted its cash pile added to the pain.
But the triggers couldn’t possibly justify the scale of the moves. When a new trigger arrived, in the form of better-than-expected data on the service sector, markets partially rebounded and the Vix fell sharply — again, far more than the data could justify.
The selloff—which at one point had chip maker Nvidia down 15%—was so big because investors had been all-in betting that things would work out well. Now things have calmed a bit, the question is whether the unwind of these bets, and the leverage behind them, is done. If it resumes, will the selloff feed back into higher savings and a weaker economy or, worse, hit the financial system?
The extreme examples of past effects from big market falls are 1987’s crash, 1998’s Long-Term Capital Management blowup and 2008’s global financial crisis. History is never perfect, but so far this looks more like a (much milder) version of 1987 than it does the other two.
In 1987, the stock market had its biggest one-day fall ever, with the S&P 500 down more than 20% on Black Monday in October. Investors had built up excessive leverage after a stunning 39% gain in the year to August’s high, and the crash led both to big margin calls and to badly designed automated trading that exacerbated the selling. But the Federal Reserve poured liquidity into the banks, brokers didn’t default and the market made back all its losses within two years. The economy was fine.
The good news was that 1987 was all about markets: They went up, they went back down, no one else was hurt. The S&P made 36% in the eight months to its August 1987 peak, similar to the 33% it rose in the eight months to the end of June this year. As in 1987, this year’s gains came in spite of tight monetary policy and higher bond yields. Just like today, in 1987 investors were on edge and ready to sell to lock in the unexpected profit. The losses are smaller so far, but lucrative trades have reversed , just as they did for the market as a whole in 1987.
In 1998, the situation was much worse, although stocks recovered more quickly. Highly levered hedge fund LTCM was crushed when Russia’s domestic debt default created a flight to safety. LTCM was big enough that it threatened to bring down Wall Street institutions. The Fed cut rates three times and pulled together a group of banks to rescue the firm and wind down its trades slowly. Stocks took just four months to recover, but the easy money helped stoke the dotcom bubble, which popped two years later and led to a mild recession—and gigantic losses for investors in tech stocks.
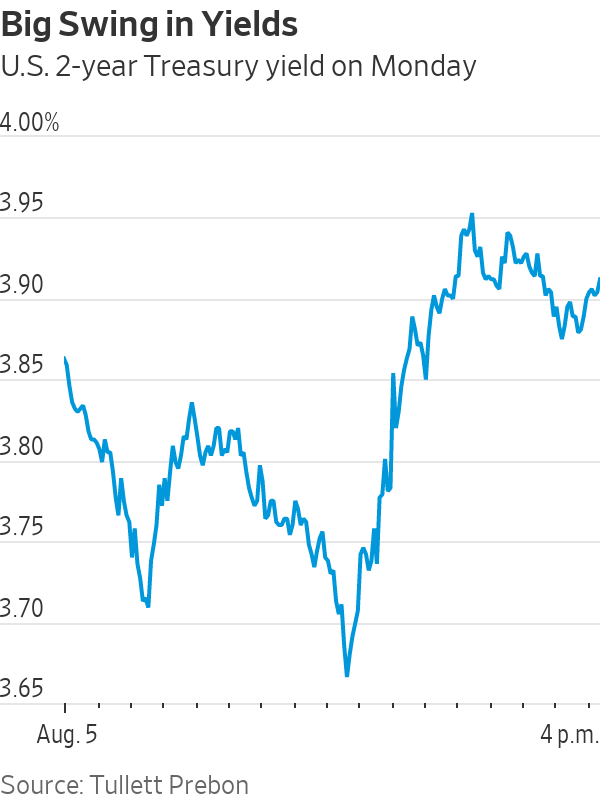
We don’t know yet if any hedge funds have been taken out by the big moves in markets, which have brought heavy losses for those engaged in the “ carry trade ” of borrowing cheaply in yen and buying higher-yielding currencies such as the Mexican peso or dollar. Large swings in Treasurys on Monday might also have hurt, given the large positions hedge funds hold. Traders are betting that the Fed will slash rates, with a super-sized cut of 0.5 percentage points priced into futures for the September meeting (and far more earlier in the day).
The really bad outcome would be a repeat of 2008, but it seems highly unlikely. True, some large U.S. banks failed last year, due to bad bets on government bonds. But banks are much less leveraged than they were, and the system is less exposed to a liquidity crisis, as private lenders have taken on much of the risk that used to sit in banks. Big losses are entirely possible, and private funds could hit trouble, but that would take time and wouldn’t create the same system-wide crisis.
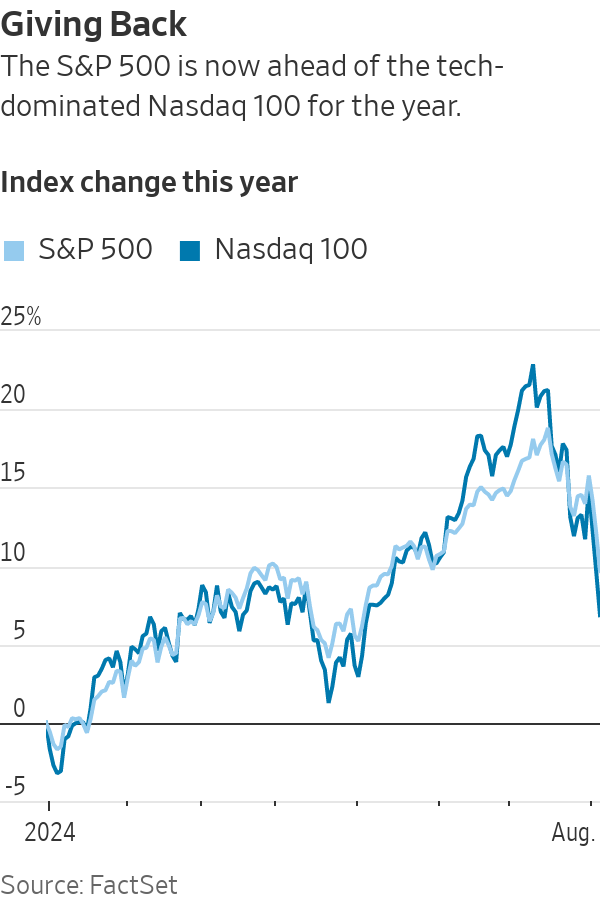
The ideal would be that excess in the stock market unwinds as in 1987 without creating wider trouble, hopefully more gradually than in 1987. AI enthusiasm could deflate stock prices much more—even after falling 30% from its June high, Nvidia has still doubled in price this year. But the market is already much closer to normal, with Monday’s falls leaving the Nasdaq 100 index up only 6% this year, and the S&P 7%.
If panic continues to abate, the Fed cuts and nothing breaks in the financial system, we should count ourselves lucky. But it would be good if investors could remember the sinking feeling they had on Monday morning, and try to be a bit wiser and less speculative.
 Copyright 2020, Dow Jones & Company, Inc. All Rights Reserved Worldwide. LEARN MORE


Ophora Tallawong has launched its final release of quality apartments priced under $700,000.

From bushland greens to valley reds, the country’s most awarded designers are proving that the best colour palette was never on a swatch card; it was outside the window all along.


The federal budget has rattled property investors. But the biggest mistake isn’t the tax changes, it’s the conclusion many are drawing from them.
2 min
The recent budget has forced a reckoning for property investors.
Negative gearing now restricted to new residential builds, the CGT discount gone and on paper, the numbers look different.
And many investors are responding by pivoting toward yield, prioritising cash flow over capital growth in a way that property strategists say misses the point entirely.
“The debate has shifted to yield versus growth as if they are opposing forces,” says Abdullah Nouh, founder of Melbourne-based buyers’ agency Mecca Property Group. “But that framing is itself the mistake.”
Nouh, who works with high-net-worth families and investors on long-term acquisition strategy, argues that capital growth remains the primary driver of genuine wealth creation and that the post-budget environment has made quality assets more important, not less.
The numbers make his case plainly. An additional $500 per week in rental income is welcome. A prestige asset appreciating by $1 million over a market cycle is transformative.
These are not equivalent outcomes, and portfolios built around yield at the expense of location and land value tend to generate income while wealth stands largely still.
The more nuanced shift Nouh is seeing among sophisticated investors is a move toward assets where both outcomes can be engineered simultaneously – established homes on substantial land in quality locations, where the existing dwelling can be repositioned, rental returns improved, and the underlying land value compounds independent of what sits on it.
For investors with existing equity, commercial property is also entering the conversation in a more serious way.
Prestige industrial assets, medical centres and long-leased essential retail offer income profiles that residential property in most capital city markets cannot currently match: longer lease terms, tenants covering outgoings, and greater predictability than the residential tenancy cycle.
“The investors who build lasting wealth are rarely the ones who chased yield or growth exclusively,” says Nouh.
“They are the ones who built a strategy they could sustain – one that generated enough income to hold quality assets through multiple cycles while those assets compounded in value.”
The budget has changed the settings. It has not changed the fundamentals.

International AI strategist Justin Kabbani will headline the Kanebridge Property Summit in Sydney on June 18, with tickets selling fast.

Brickworks has enlisted acclaimed architecture studio Kennedy Nolan to explore how homes could become more adaptable, energy-efficient and connected to community.