Japan Is Back. Is Inflation the Reason?
Deflation might be vanquished, but the payoff could be elusive

 4 min
4 min
The Nikkei stock index recorded last week its first new high in 34 years, a fitting tribute to Japan’s re-emergence as a genuinely exciting economy.
It also comes amid mounting evidence that Japan has finally broken the hold of deflation. Inflation in January was 2.2%, the 22nd month above 2%. Wage growth has picked up too.
This appears to vindicate the economic consensus that deflation was a primary driver of Japan’s decades long malaise. But that conclusion might be premature. Proof of deflation’s harm has been elusive, and the benefits of low, positive inflation might be similarly subtle.
Consumers are often surprised to hear that deflation is supposed to be bad. In the U.S., where prices have risen steeply since 2021 , normal people, and even economists, wouldn’t object if they fell a bit.
The trouble arises when prices fall persistently, year in and year out, because wages, incomes and the prices of assets such as property tend to follow. Debtors struggle to repay loans and might slash spending or default, endangering the financial system. That is what happened in the U.S. when prices fell 27% from 1929 to 1933.
Even mild deflation can, in theory, inhibit growth. Central banks stimulate spending by lowering nominal interest rates below inflation to make the real—i.e., inflation-adjusted—cost of borrowing negative. That is almost impossible when inflation is itself negative.
The roots of deflation
Japan’s deflation began after its property and stock-market bubbles burst in the early 1990s. Ensuing losses at banks eroded their ability to lend. Inflation turned negative in 1999.
Western economists such as future Federal Reserve Chair Ben Bernanke argued that curing deflation was essential to restoring Japan’s economic health. The Bank of Japan agreed, at first half heartedly and then wholeheartedly.
It used zero, then negative, short-term interest rates. Next came purchases of short-term, then long-term, government securities. Finally, the BOJ even bought shares in companies with newly created money to stimulate spending and raise inflation.
The BOJ only succeeded in bringing inflation up to around zero. It took the global supply chain shocks of the pandemic to finally push underlying inflation to 2%, the bank’s target .
Japan’s 25 years of zero to negative inflation was accompanied by one of the rich world’s lowest growth rates. Japanese deflation became a cautionary tale for other countries, most recently China, where prices are currently falling .
Yet proving that deflation was behind Japan’s problems is maddeningly hard. Arguably, it was more symptom than cause.
In the early 1990s, working-age population growth turned negative. This happened just as Japan’s post-World War II phase of catching up to other developed nations ended. Meanwhile, industry began moving production to lower-wage countries.
All this, plus the banking crisis, put structural downward pressure on prices, wages and growth.
Underlying performance
Adjusted for its shrinking population, however, Japan’s performance has been respectable. From 1991 to 2019, its output per hour worked rose 1.3% a year. This was slower than in the U.S. but comparable with Canada, France, Germany and Britain, and faster than Italy or Spain, according to the economists Jesús Fernández-Villaverde, Gustavo Ventura and Wen Yao.
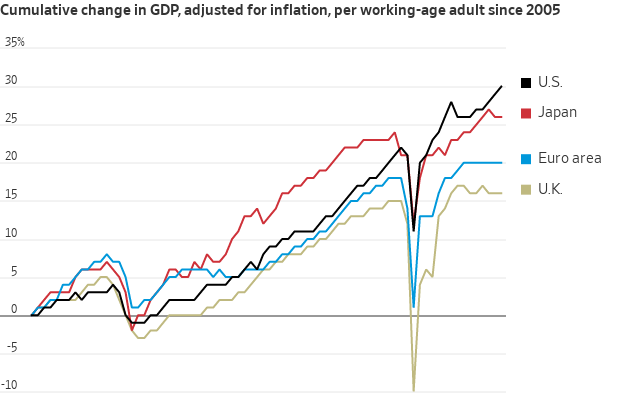
Since 2019, output per working-age person rose 7% in the U.S., 5% in Japan, 2% in the eurozone and zero in Britain, by my calculations. (This might overstate Japan’s performance because many of its elderly still work.) As any visitor can attest, Japan remains a prosperous, harmonious and well-ordered place.
“Had you appointed me governor of the Bank of Japan for 25 years with all the power in the world, I don’t think I would have been able to do better,” said Fernández-Villaverde.
This doesn’t prove deflation was benign. Growth (and deflation) might have been worse without the BOJ’s herculean monetary efforts. And if inflation had been positive, growth might have been stronger.
Still, it raises an awkward question: If zero to negative inflation is so damaging, where is the evidence?
The price mechanism
The harm might lie in subtle behavioural changes by investors, companies and the public. For example, in a market economy, changing relative prices and wages are critical signals for reallocating capital and labor from stagnant to growing sectors.
Relative prices changes are unusually rare in Japan, according to the University of Tokyo economist Tsutomu Watanabe. He has found that from 1995 through 2021, prices of more than half of products didn’t change at all from year to year. This wasn’t just because average inflation was lower; price changes deviated from the average much less than in other countries.
In a December speech, Bank of Japan Governor Kazuo Ueda said years of low to negative inflation led to a “status quo in wage- and price-setting behaviour,” so many prices and wages didn’t change. “The know-how for raising prices was thus lost,” he said.

The absence of this price-discovery function, Ueda contended, sapped productivity and dynamism.
Watanabe’s research shows that since January 2022, prices have been less sticky and more dispersed. Coincidentally, the Nikkei’s latest rally began a year later.
This in great part reflects the enthusiasm of foreign investors such as Warren Buffett , shareholder-friendly changes in corporate governance, and Japan’s importance as an alternative to China for high-end manufacturing and technology.
Inflation, though, might also be a factor, said Paul Sheard , a former vice chairman at S&P Global who has studied the Japanese economy for decades. He added that investors care about nominal, not real, stock prices, earnings, dividends and cash flow.
Higher inflation flatters all those metrics. That benefit might be neutralised by higher interest rates, but Japanese bond yields have risen less than expected inflation, so real yields are down to minus 0.6%.
So perhaps inflation is reviving businesses’ and investors’ animal spirits. Even so, growth last year was about the same as before the pandemic and turned slightly negative in the third and fourth quarters, producing a technical recession . What’s more, wages have lagged behind inflation, and Prime Minister Fumio Kishida ’s approval ratings have plummeted.
Japan might have prevailed in its war against deflation. But ordinary Japanese have yet to see a peace dividend.
 Copyright 2020, Dow Jones & Company, Inc. All Rights Reserved Worldwide. LEARN MORE


From elevated skincare to handcrafted home pieces, this year’s most thoughtful gifts go beyond the expected.

A haven for hedge-fund titans and Hollywood grandees, Greenwich is one of the world’s most expensive residential enclaves, where eye-watering prices meet unapologetic grandeur.


The lunar flyby would be the deepest humans have traveled in space in decades.
4 min
It’s go time for the highest-stakes mission at NASA in more than 50 years.
On April 1, the agency is set to launch four astronauts around the moon, the deepest human spaceflight since the final Apollo lunar landing in 1972.
The launch window for Artemis II , as the mission is called, opens at 6:24 p.m. ET.
National Aeronautics and Space Administration teams have been preparing the vehicles to depart from Florida’s Kennedy Space Center on the planned roughly 10-day trip. Crew members have trained for years for this moment.
Reid Wiseman, the NASA astronaut serving as mission commander, said he doesn’t fear taking the voyage. A widower, he does worry at times about what he is putting his daughters through.
“I could have a very comfortable life for them,” Wiseman said in an interview last September.
“But I’m also a human, and I see the spirit in their eyes that is burning in my soul too. And so we’ve just got to never stop going.”
Wiseman’s crewmates on Artemis II are NASA’s Victor Glover and Christina Koch, as well as Canadian Space Agency astronaut Jeremy Hansen.

What are the goals for Artemis II?
The biggest one: Safely fly the crew on vehicles that have never carried astronauts before.
The towering Space Launch System rocket has the job of lofting a vehicle called Orion into space and on its way to the moon.
Orion is designed to carry the crew around the moon and back. Myriad systems on the ship—life support, communications, navigation—will be tested with the astronauts on board.
SLS and Orion don’t have much flight experience. The vehicles last flew in 2022, when the agency completed its uncrewed Artemis I mission .
How is the mission expected to unfold?
Artemis II will begin when SLS takes off from a launchpad in Florida with Orion stacked on top of it.
The so-called upper stage of SLS will later separate from the main part of the rocket with Orion attached, and use its engine to set up the latter vehicle for a push to the moon.
After Orion separates from the upper stage, it will conduct what is called a translunar injection—the engine firing that commits Orion to soaring out to the moon. It will fly to the moon over the course of a few days and travel around its far side.
Orion will face a tough return home after speeding through space. As it hits Earth’s atmosphere, Orion will be flying at 25,000 miles an hour and face temperatures of 5,000 degrees as it slows down. The capsule is designed to land under parachutes in the Pacific Ocean, not far from San Diego.

Is it possible Artemis II will be delayed?
Yes.
For safety reasons, the agency won’t launch if certain tough weather conditions roll through the Cape Canaveral, Fla., area. Delays caused by technical problems are possible, too. NASA has other dates identified for the mission if it doesn’t begin April 1.
Who are the astronauts flying on Artemis II?
The crew will be led by Wiseman, a retired Navy pilot who completed military deployments before joining NASA’s astronaut corps. He traveled to the International Space Station in 2014.
Two other astronauts will represent NASA during the mission: Glover, an experienced Navy pilot, and Koch, who began her career as an electrical engineer for the agency and once spent a year at a research station in the South Pole. Both have traveled to the space station before.
Hansen is a military pilot who joined Canada’s astronaut corps in 2009. He will be making his first trip to space.
Koch’s participation in Artemis II will mark the first time a woman has flown beyond orbits near Earth. Glover and Hansen will be the first African-American and non-American astronauts, respectively, to do the same.
What will the astronauts do during the flight?
The astronauts will evaluate how Orion flies, practice emergency procedures and capture images of the far side of the moon for scientific and exploration purposes (they may become the first humans to see parts of the far side of the lunar surface). Health-tracking projects of the astronauts are designed to inform future missions.
Those efforts will play out in Orion’s crew module, which has about two minivans worth of living area.
On board, the astronauts will spend about 30 minutes a day exercising, using a device that allows them to do dead lifts, rowing and more. Sleep will come in eight-hour stretches in hammocks.
There is a custom-made warmer for meals, with beef brisket and veggie quiche on the menu.
Each astronaut is permitted two flavored beverages a day, including coffee. The crew will hold one hourlong shared meal each day.
The Universal Waste Management System—that’s the toilet—uses air flow to pull fluid and solid waste away into containers.
What happens after Artemis II?
Assuming it goes well, NASA will march on to Artemis III, scheduled for next year. During that operation, NASA plans to launch Orion with crew members on board and have the ship practice docking with lunar-lander vehicles that Elon Musk’s SpaceX and Jeff Bezos’ Blue Origin have been developing. The rendezvous operations will occur relatively close to Earth.
NASA hopes that its contractors and the agency itself are ready to attempt one or more lunar landing missions in 2028. Many current and former spaceflight officials are skeptical that timeline is feasible.

From mud baths to herbal massages, Fiji’s heat rituals turned one winter escape into a soul-deep reset.

French luxury-goods giant’s results are a sign that shoppers weren’t splurging on its collections of high-end garments in the run-up to the holiday season.