One of the Biggest AI Boomtowns Is Rising in a Tech-Industry Backwater
Blackstone and TikTok’s parent are among those investing in data centers in Malaysia’s Johor, known for palm-oil plantations

 4 min
4 min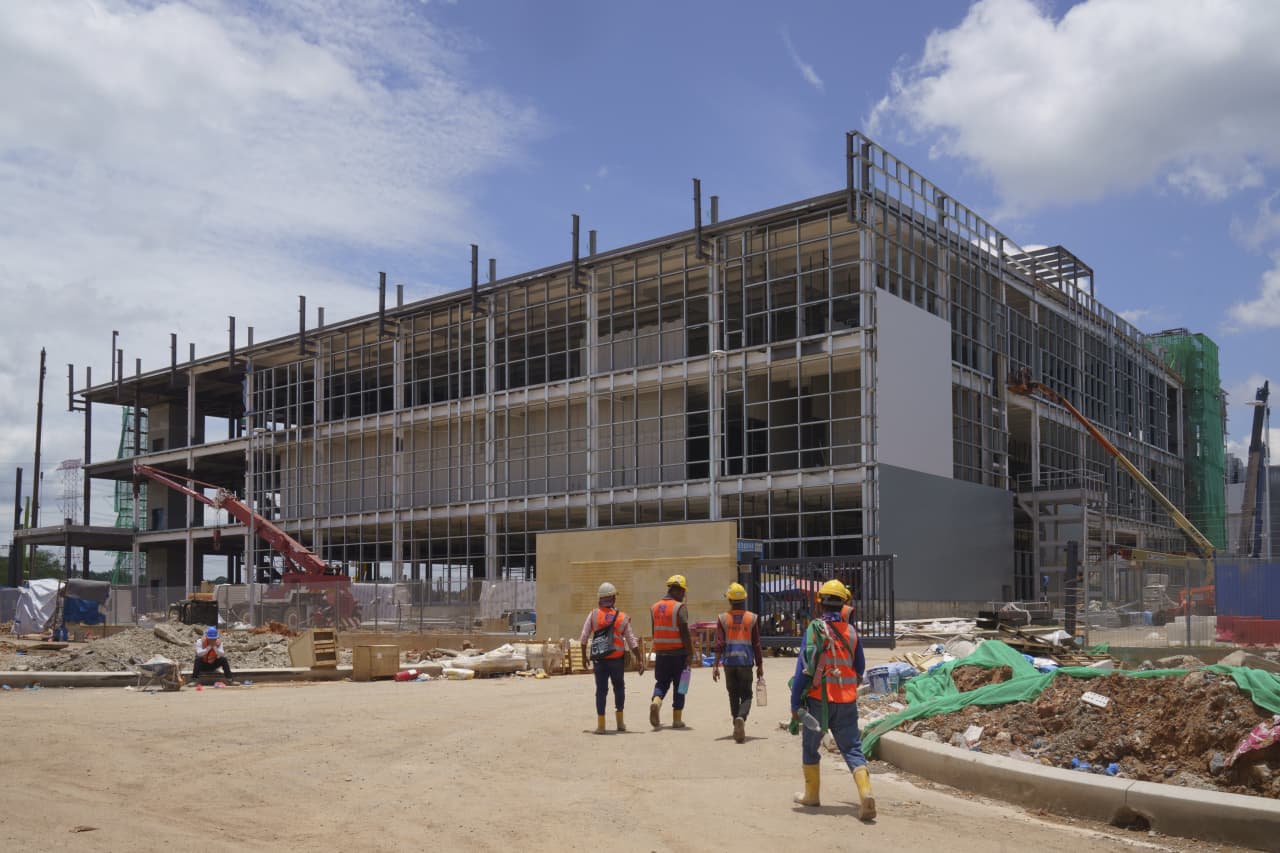
ISKANDAR PUTERI, Malaysia— Gary Goh was the chief executive of a publicly listed property developer three years ago when prospective clients started asking whether his company had land for data centres.
Goh was vaguely aware that technology companies needed computer centres to manage heaps of data, but he had never seen such a building. “I didn’t know whether it was round, was it a rectangle, was it a triangle?” he said.
But after the 10th inquiry, Goh realised the tech industry was about to spend billions of dollars on data centres in his sleepy corner of Malaysia. So he quit his job to cash in.
Nowhere else on Earth has been physically reshaped by artificial intelligence as quickly as the Malaysian state of Johor. Three years ago, this region next to Singapore was a tech-industry backwater. Palm-oil plantations dotted the wetlands. Now rising next to those tropical trees 100 miles from the equator are cavernous rectangular buildings that, all together, make up one of the world’s biggest AI construction projects.
TikTok’s Chinese parent company, ByteDance , is spending $350 million on data centres in Johor. Microsoft just bought a 123-acre plot not far away for $95 million. Asset manager Blackstone recently paid $16 billion to buy AirTrunk , a data-centre operator with Asia-wide locations including a Johor facility spanning an area the size of 19 football fields. Oracle last week announced a $6.5 billion investment in Malaysia’s data-centre sector, though it didn’t specify where.
In all, investments in data centres in Johor, which can be used for both AI and more conventional cloud computing, will reach $3.8 billion this year, estimates regional bank Maybank.
“At first glance, Johor seems unlikely, but once you double click on it, it makes a lot of sense,” said Peng Wei Tan, a Blackstone senior managing director who helped lead its acquisition of AirTrunk.
To understand how one of the first boomtowns of the AI era sprouted at the southern tip of the Malay Peninsula, consider the infrastructure behind AI.
Tech giants want to train chatbots, driverless cars and other AI technology as quickly as possible. They do so in data centres with thousands of computer chips, which require a lot of power, as well as water for cooling.
Northern Virginia became the world’s biggest data-centre market because of available power, water and land. But supply is running low. Tech companies can’t build data centres fast enough in the U.S. alone.
Enter Johor. It has plentiful land and power—largely from coal—and enough water. Malaysia enjoys generally friendly relations with the U.S. and China, reducing political risk for companies from the rival nations.
The other important factor: location. Across the border is Singapore, which has one of the world’s densest intersections of undersea internet cables. Those are modern-age highways, enabling tech companies to sling mountains of data around the world.
“This Johor development isn’t for serving just Malaysia,” said Rangu Salgame , chief executive of Princeton Digital Group, a data-centre operator that counts some of the world’s biggest tech companies as clients. “This is AI being deployed globally.”
Working with government
Salgame said companies previously built data centres in Singapore because of its interconnectivity. But in 2019, the tiny and densely populated island nation put a moratorium on new centres because of energy constraints. So data-centre operators did the next best thing, which was to go an hour across the bridge.
While Amazon , Google, Meta and other tech giants run their own data centres, they also rely on third-party data-centre operators for 30% of their needs in the U.S. and about 90% of their needs internationally, Salgame said.
The third parties construct data centres, which cost $1 billion to $2 billion each. Tech companies act as tenants, installing their own hardware inside. Most Johor data centres are run by third parties, which don’t necessarily have agreements with tech clients before starting projects.
“We’re going in speculatively,” Salgame said.
Salgame said he gets insights from big tech companies before beginning projects, so he has a sense of what they want. And the sense now is they want Johor.
Salgame predicts that the Malaysian state will become the world’s second-biggest data-center market within five years. “I’ve never seen anywhere in the world come up at this speed,” he said.
The industry measures data-centre markets by the electricity they use. Northern Virginia has about 4.2 gigawatts active and an additional 11.4 gigawatts under construction, committed or in early stages, said Vivian Wong , an analyst at research firm DC Byte.
Johor, after having less than 10 megawatts—or 0.01 gigawatts—three years ago, now has 0.34 gigawatt active and an additional 2.6 gigawatts under construction, committed or in early stages.
Help from government
Government officials have mostly encouraged the investments, streamlining the permitting process. Salgame said his company’s Johor center was proposed, constructed and operating within 15 months.
But the mayor of Johor Bahru, the state capital, said the government must balance economic benefits with local needs. He said it should consider building desalination plants, among other things, to ensure locals have enough water. The area has faced shortages.
“We know that people are too hyped about data centres,” said the mayor, Mohd Noorazam Osman, at a recent conference.
After quitting his property-development job, the 40-year-old Goh started consulting for potential land buyers and sellers. His specialty was knowing which sites among the plantations and swamps could be easily converted into data centres.
He found success in the Johor city of Iskandar Puteri, where telecom carriers recently broke ground on a 42-acre lot across the street from a McDonald’s. The site isn’t perfect. A hill needs to be flattened before further construction occurs.
But on a recent sweltering day, Goh pointed at the power lines and light-blue water pipes running through the lot, signifying easy access to electricity and water. “These conditions are hard to come by,” he said.
 Copyright 2020, Dow Jones & Company, Inc. All Rights Reserved Worldwide. LEARN MORE





From making unpopular decisions to learning when to listen, leaders from five businesses reveal what nobody prepared them for — and how running a company has challenged their expectations.

Technology and semiconductor shares fell sharply as investors questioned the debt financing the AI infrastructure boom and confronted higher rates and Chinese competition.

Technology and semiconductor shares fell sharply as investors questioned the debt financing the AI infrastructure boom and confronted higher rates and Chinese competition.
4 minA sharp technology sell-off has exposed a new anxiety on global markets: whether the enormous borrowing behind the artificial-intelligence infrastructure boom can generate sufficient returns as interest rates rise and Chinese competition intensifies.
The artificial-intelligence investment boom has powered technology shares, semiconductor manufacturers and data-centre operators to extraordinary heights. Last week, investors were given a reminder that much of this expansion is being built with borrowed money.
The technology-heavy Nasdaq Composite fell 4.5 per cent over the week ended October 16, its weakest performance since late June. Semiconductor shares suffered an even deeper correction, with the Philadelphia Semiconductor Index losing about 11.4 per cent.
The selling spread quickly through global markets. Micron Technology fell 14.6 per cent over the week, while South Korea’s Samsung Electronics and SK Hynix dropped approximately 18 per cent and 24 per cent respectively.
This was more than a routine bout of profit-taking. Investors were reassessing three interconnected risks: higher interest rates, the rapidly expanding debt burden attached to AI infrastructure and the prospect of stronger competition from Chinese memory-chip manufacturers.
The debt behind the AI build-out
Artificial intelligence requires a physical infrastructure network of enormous scale. Data centres must be built, advanced processors purchased, power supplies secured and cooling systems installed before customers begin generating meaningful revenue from them.
Technology companies are increasingly supplementing their own cash with corporate bonds, syndicated loans, equipment leases, private credit and project-level financing.
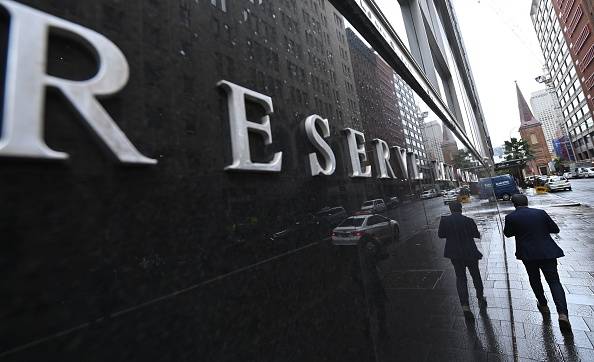
JPMorgan describes the emerging funding model as a combination of conventional corporate borrowing and project finance tied to individual data-centre assets. In Australia, the Reserve Bank estimates that syndicated loans accounted for approximately three-quarters of data-centre financing during 2025 and 2026 to date.
The numbers are becoming large enough to affect broader credit markets. The Federal Reserve Bank of Dallas has cited Wall Street estimates suggesting AI-related investment-grade bond issuance could approach US$300 billion in 2026 alone.
That borrowing is not automatically problematic. Debt can be an efficient way to finance long-lived infrastructure when future revenue is sufficiently predictable. The concern is that AI technology, customer demand and computing economics are changing much faster than the repayment schedules attached to the assets.
A data centre financed today may carry debt for years. Investors must therefore make assumptions about future utilisation rates, electricity prices, chip performance, customer concentration and the amount businesses will ultimately pay for AI computing.
When interest rates rise, those assumptions become less forgiving.
Inflation changes the calculation
September’s US inflation data intensified the pressure. Consumer prices increased 3.7 per cent over the year, ahead of market expectations and up from 3.4 per cent in August.
The hotter reading reduced confidence that interest rates would fall quickly and pushed bond yields higher. That matters particularly for companies whose valuations depend on profits expected well into the future, as well as highly leveraged infrastructure operators that may need to refinance.
CoreWeave has emerged as a closely watched test case. The specialist cloud-computing company has accumulated substantial debt and lease obligations to build AI capacity, while relying on a concentrated group of large technology customers.
Its shares fell sharply during the sell-off, while the cost of insuring its debt against default climbed. CoreWeave has argued that its contracted backlog more than covers its obligations and that financial markets do not always understand its business model. Nevertheless, its securities have become a proxy for investor confidence in debt-funded AI infrastructure.
Oracle, another major investor in AI computing capacity, fell 8.8 per cent in Friday trading, while CoreWeave dropped 15.5 per cent.
The question is shifting from how much AI infrastructure can be built to how profitably it can be operated.
China adds another source of pressure
Interest rates were not the only catalyst. Reports of advances by Chinese memory-chip producer ChangXin Memory Technologies raised concerns that lower-cost Chinese products could increase competition across the global semiconductor industry.
Memory chips are essential to AI systems, but the industry is historically cyclical. Periods of tight supply and high pricing can encourage rapid investment, eventually producing oversupply and falling margins.
The prospect of a well-funded Chinese competitor expanding its technological capabilities unsettled investors in Samsung, SK Hynix and Micron. It also demonstrated that AI-related demand does not insulate chipmakers from conventional competitive pressures.
That combination—slower rate cuts, more expensive financing and potentially cheaper supply—challenged the assumption that every company exposed to AI would enjoy continually expanding margins.
A reset rather than the end of the boom
The sell-off does not establish that the AI boom is ending. Demand for computing power remains strong, the largest technology companies continue to generate formidable cash flows and many infrastructure projects are backed by long-term customer contracts.
What has changed is the market’s willingness to overlook the price and financing structure of that growth.
The most resilient companies are likely to be those able to fund investment from operating cash flow, secure long-duration customers and demonstrate that new capacity will earn returns comfortably above its financing costs.
More speculative operators may face greater scrutiny, particularly where debt is expensive, customers are concentrated or expected revenue depends on demand that has not yet materialised.
For Australian investors, the lesson extends beyond US technology shares. Local data-centre operators, infrastructure funds, electricity suppliers and property groups are increasingly exposed to the same investment cycle.
Artificial intelligence may remain one of the defining growth themes of the decade. But last week’s correction showed that enthusiasm for the technology does not eliminate financial discipline.
The next stage of the AI boom will be judged not only by computing power, model performance or demand for chips, but by something more traditional: whether the assets being financed can generate enough cash to repay the money borrowed to build them.
Fact box
Nasdaq Composite: Down 4.5 per cent for the week ended October 16, 2026
Philadelphia Semiconductor Index: Down approximately 11.4 per cent
Micron Technology: Down approximately 14.6 per cent
Samsung Electronics: Down approximately 18 per cent
SK Hynix: Down approximately 24 per cent
US September inflation: 3.7 per cent annually
Estimated 2026 AI-related investment-grade issuance: Approximately US$300 billion

New research suggests that bonuses make employees feel more like a mere cog in a wheel.

Scotch whisky expert, luxury hospitality strategist and Keeper of the Quaich inductee Ross Blainey is bringing a new philosophy of luxury experiences to Citizen Kanebridge.