The Stock Market’s Magnificent Seven Is Now the Fab Four
It is a bullish signal that the market is rallying without the likes of Apple and Tesla, some investors say

 4 min
4 min
The Magnificent Seven trade is beginning to fizzle—and yet, the stock market is still heading higher.
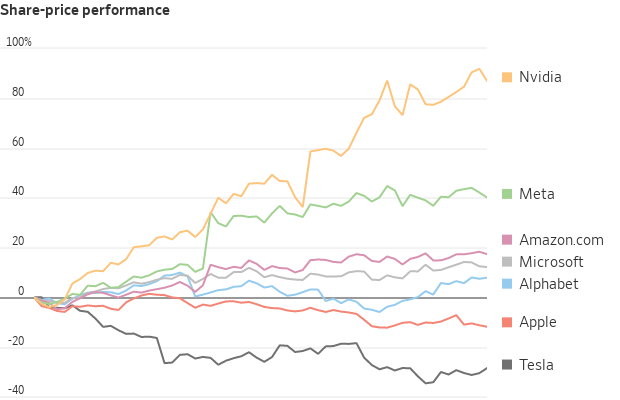
The S&P 500 climbed 10% in the first quarter, its best start to a year since 2019 , even though two of its biggest constituents suffered double-digit declines. Apple shares fell 11% in the first three months of the year, while Tesla dropped almost 30%. Alphabet shares sputtered for much of the period before making a run in the past three weeks and ending up 8%.
The other four big tech stocks in the group known as the Magnificent Seven— Nvidia , Meta Platforms , Microsoft , Amazon.com —continued their meteoric run and outpaced the broader market. Some market strategists have dubbed them the new Fab Four.
Some investors say it is a bullish signal that the market is still rallying without the likes of Apple and Tesla because it means other groups are taking part . All of the S&P 500’s sectors, except real estate, logged gains in the first quarter. Small caps, industrial and financial-services stocks are among those that jumped, fueling bets that the broader market might have more room to run.
Much of the enthusiasm is tied to hopes that the economy has escaped a deep recession and that the Federal Reserve will soon pivot to cutting interest rates , even if not at the pace some investors had previously hoped. A frenzy over the future of artificial intelligence has added to the zeal.
“If you’d have told me eight weeks ago that Apple and Tesla would be down as much as they are, oh and by the way, you’re punting when you’re going to do the rate cuts and you’re getting less rate cuts, I would have assumed the market would be down,” said Ryan Detrick , chief market strategist at Carson Group.
To be sure, some investors worry the divergence in the big tech stocks is a sign of exhaustion in the rally and question whether future gains will be harder to achieve from here. The S&P 500’s market value has swelled more than $9 trillion since late October, and the index has set 22 record closes in 2024.
In the coming days, investors trying to gauge the trajectory of the market and economy will parse the release of U.S. manufacturing data Monday and the monthly jobs report Friday.
Nvidia continues to be a stock-market star. The graphics-chip maker has indicated demand for the computing power that underlies AI remains astronomical . Its shares have jumped more than 80% to start the year, after more than tripling in 2023.
By some metrics, Nvidia has displaced Tesla as the most popular stock among individual investors . It is currently the biggest average holding in individual investors’ portfolios, at about 9%, VandaTrack data show.
Meta shares, meanwhile, have soared partly thanks to Meta’s investments in artificial intelligence that have made targeted ads smarter. The social-media company recently said it would pay its first shareholder dividend. Microsoft stole the crown of biggest U.S. company from Apple earlier this year, with a valuation that topped $3 trillion, and Amazon has sharply improved its profitability.
Despite their recent gains, some of the stocks look less pricey than they did last year. Nvidia is trading at 35 times its projected earnings over the next 12 months, below its peak of 62 in May of last year. Amazon’s multiple is 40, down from 2023’s high of 62. The S&P 500 is trading at 21 times future earnings, slightly up from last year’s highs of 19.
The Fab Four are responsible for nearly half of the S&P 500’s first-quarter advance, according to Howard Silverblatt , senior index analyst at S&P Dow Jones Indices.
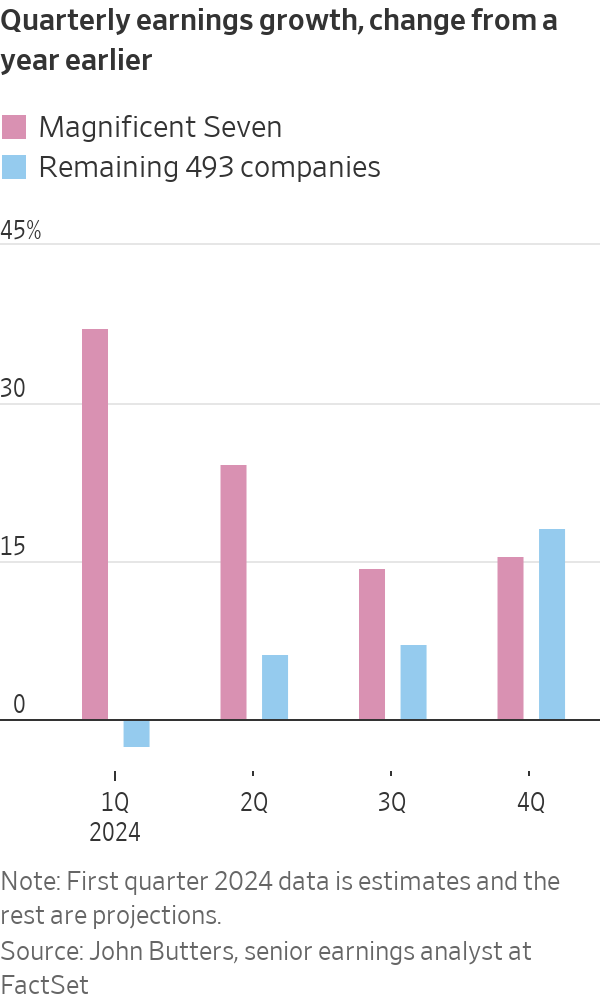
Joseph Ferrara , investment strategist at Gateway Investment Advisers, said he expects investors to rotate out of big tech stocks and funnel into other sectors as the year progresses. That is largely because the earnings of the other 493 companies in the index are expected to outperform those of the Magnificent Seven by the fourth quarter.
“The fact that the market is still holding these levels and trading up without that full force of the Magnificent Seven is actually a really positive thing,” he said.
Jonathan Golub , a strategist at UBS, said one reason Magnificent Seven’s earnings dominance could end is because it will be hard to top the explosive growth they posted at the end of last year. Those results looked like blockbuster beats when compared with 2022’s weaker numbers, he said in a recent research note.
Last year, any hint of weakness in the Magnificent Seven would have sent the broader market tumbling. In fact, for much of the year, those seven stocks were responsible for all of the S&P 500’s advance.
This year is a different story. Tesla is struggling on numerous fronts. The electric-vehicle maker is facing pressure from Chinese competitors, which have rapidly expanded their presence around the globe in recent years. It has also warned of notably slower growth in 2024, and its profit margins have taken a hit.
Apple’s woes have been mounting, too . The Justice Department recently sued the company, accusing it of monopolistic behaviour. European authorities are cracking down on its app store. Plus, it is facing another weak iPhone demand cycle, and investors are worried that Apple is behind in the current wave of excitement around AI.
Bespoke Investment Group data show Apple shares underperformed the S&P 500 over the 200 days through Tuesday by the widest margin since October 2013.
 Copyright 2020, Dow Jones & Company, Inc. All Rights Reserved Worldwide. LEARN MORE


A record-breaking $11 million sale at The Centennial Collection has set a new benchmark for luxury apartment living in Bondi Junction.

As interest rates, inflation and market sentiment fluctuate, investors are being urged to focus on data, not panic.


The Federal Budget may have softened some of its proposed tax reforms, but it has exposed a bigger issue: too many families are relying on wealth structures that no longer reflect the realities of modern life.
3 min
For many Australians, the 2026 Federal Budget initially felt like a direct challenge to the way wealth is created, held and transferred between generations.
The headlines were immediate: changes to capital gains tax, reforms to discretionary trusts, restrictions on negative gearing and increased scrutiny of investment structures. Unsurprisingly, affluent families, business owners and investors began asking the same question:
Is the way we hold our wealth still fit for purpose?
In recent days, the government has announced several significant amendments following industry consultation and public feedback, including exempting testamentary trusts from the proposed 30 per cent minimum tax and expanding capital gains tax concessions for small businesses.
The backdown is welcome. But it also highlights something much bigger.
This Budget has accelerated a conversation that many Australian families have been postponing for years.
The conversation is not really about tax. It is about wealth stewardship.
For decades, Australians have built wealth through businesses, property, investments and careful long-term planning. Yet many families have not revisited the legal structures surrounding those assets in years, sometimes decades.
We often see clients who have spent years building significant wealth, only to discover their legal arrangements no longer reflect their current circumstances.
Their children are now adults. They may own multiple properties.
They may have sold a business, entered a second marriage, become grandparents or accumulated digital assets that did not exist when their original estate plans were prepared.
The trust that distributes income may need to be reconsidered. The bucket company may no longer be so attractive.
The Budget has simply exposed a reality that already existed: wealth structures cannot remain static while life continues to evolve.
Importantly, trusts themselves are not the issue.
Trusts are legitimate planning tools that provide flexibility, protection and continuity. When used appropriately, they allow families to adapt to changing circumstances over time.
And neither is tax the issue, really. Getting the fundamentals right is more important for long-term, sustainable wealth than a few favourable tax treatments around the edges.

The real issue is complacency.
Too often, families create structures and assume the job is done. It isn’t.
Estate planning is no longer a document you sign once and file away in a drawer. It is an ongoing process that should evolve alongside your life.
We are also seeing a broader shift in how Australians define wealth itself. It is no longer just the family home and an investment portfolio.
Modern wealth includes businesses, digital assets, cryptocurrency, intellectual property, frequent flyer points and increasingly complex family arrangements.
At the same time, Australians are living longer than ever before, meaning wealth may need to support multiple generations simultaneously. This creates new responsibilities and new risks.
How do you help your children enter the property market without exposing family wealth to relationship breakdowns?
How do you structure wealth so that it remains a source of opportunity rather than future conflict?
These are the questions families should be asking now.
The recent debate surrounding testamentary trusts also serves as an important reminder that policy decisions can have unintended consequences for vulnerable Australians. It is encouraging that the government has listened to feedback and clarified its position.
But the lesson remains: the wealth landscape is changing.
Increasingly, governments, regulators and tax authorities are paying closer attention to how wealth is held and transferred. That means families cannot afford to adopt a “set-and-forget” approach to their structures.
The families who will be best placed for the future are not necessarily those with the greatest wealth.
They are the families with the greatest clarity. Clarity around ownership, succession and governance. And clarity around how wealth will transition from one generation to the next.
Ultimately, preserving wealth is not about avoiding change.
It is about preparing for it.
Because the greatest risk is not change itself.
It is losing the ability to respond to it.
Anthony Hunt is Co-Founder of Wealth Lawyers and former COO of Westpac Private Bank. He advises business owners, investors and affluent Australian families on wealth protection, succession planning and intergenerational wealth transfer

Wealthy Aussies are swapping large family homes for high-end apartments, with sales of prestige units tripling over the past decade.

Records keep falling in 2025 as harbourfront, beachfront and blue-chip estates crowd the top of the market.