Toy Shoppers Come Down With a Case of the Holiday Blahs
Sales of toys and games slump as Americans show signs of pulling back

 4 min
4 min
Shoppers couldn’t get enough toys and games during the pandemic. Now, they are finding other ways to spend their time, and that is spelling trouble for toy makers and sellers.
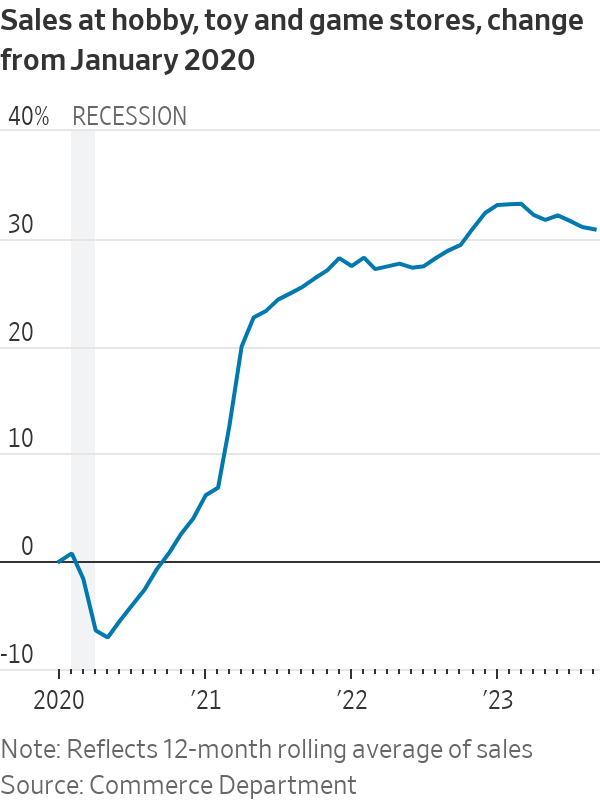
Sales of toys have slumped so far this year, down 8% through September compared with the same period last year, according to market-research firm Circana, and appeared poised to be lacklustre this holiday season. Imports of toys and games have fallen sharply this year and sales at toy stores, department stores and other gift sellers declined in October, leading a broader pullback.
A retrenchment on the most fun-to-give gifts sends a signal that Americans are starting to ease their spending more broadly as pandemic savings dwindle, the labor market softens and shoppers worry about global events and still-elevated inflation. Easing consumer spending would cool overall growth, because it accounts for more than two-thirds of economic activity.
This holiday season is off to a slow start for Wildlings Toy Boutique in Phoenix, which sells classic toys dollhouses and wooden cars and accessories. The store has been trying to drum up customer interest with experiences, including Santa visits and family photo shoots in front of a Christmas-tree backdrop outside the store.
“I think people are reluctant to spend as much and to spend as early,” said owner Jennifer Mawcinitt, who expects people to come in looking for deals on Black Friday.
Larger retailers are seeing similar trends.
Customers are “showing ongoing discretion and making trade-offs to be able to afford the things they want, given the sustained high cost of the things they need,” Walmart Chief Financial Officer John David Rainey told analysts last week.
Experiences valued over things
Early in the pandemic, when many were unable to travel and dine out, Americans shifted their spending toward goods, including toys, games and electronics. That has reversed.
Spending on services has grown roughly double the pace of goods for most of this year as consumers caught up on experiences such as concerts and trips to Europe.
Fewer board games and puzzles are coming off toy store shelves because “people are going outside,” said Katherine Nguyen, owner of Building Blocks Toy Stores, which has three locations in Chicago.
Nguyen is seeing an exception: Shoppers can’t wait to get their hands on toys they can squeeze, such as the Bitzee digital pet and Squishable plush toys. “I don’t have a store big enough to sell” all the stuffed animals now in demand, Nguyen said. She added that those toys are popular in part because they are geared toward social and emotional self-care as children navigate post pandemic life.
Hannah Sweet, a retired care manager in Tiburon, Calif., said she is more cautious about spending this holiday season than in previous years, pointing to concerns about an economic downturn. Economists surveyed by The Wall Street Journal last month put the probability of a recession in the next year at essentially a coin flip.
“I am prioritising gifts to children and grandchildren,” said Sweet, 81 years old. Still, she recently took a trip to Germany and next year plans to go on a river cruise in Europe with family. “It’s important to travel while I can,” Sweet said.
The National Retail Federation, a trade group, expects November and December holiday spending to rise 3% to 4% this year from last, or hold about flat when factoring in inflation. That would be slower than a 5.4% increase in 2022 and a 13% rise in 2021.
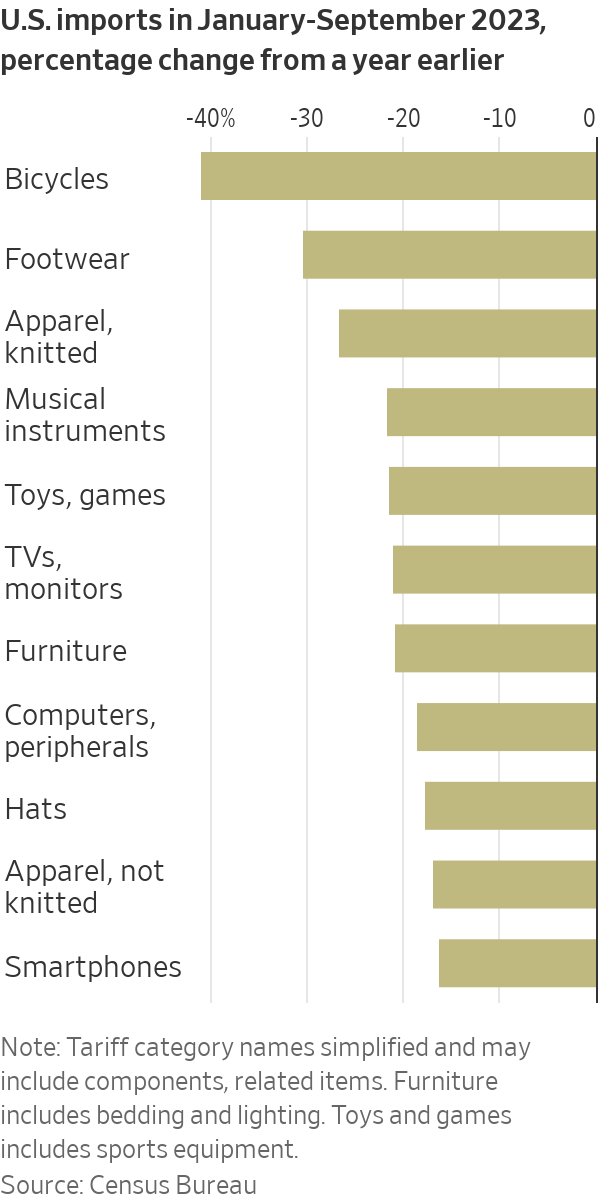
Expecting potentially weaker demand, retailers and other sellers ordered fewer toys and other popular gifts from overseas. U.S. imports of toys, games and sporting goods dropped 21.5% in the nine months through September, compared with the same period a year earlier, according to the Commerce Department. Bicycle imports fell more than 40%; smartphones declined 16%.
Toy companies struggled to clear out bloated inventories in 2022 after supply-chain snags left retailers with extra stock. Barbie maker Mattel warned that rising prices across the economy and high borrowing costs would likely continue to dent demand for toys this holiday season. Chief Executive Ynon Kreiz said last month that overall industry sales would fall by a mid-single-digit percentage for the full year.
Hasbro, the maker of Monopoly, Play-Doh and Transformers action figures, reported a 10% drop in revenue in the third quarter and cut its full-year guidance because of weak demand.
“We have a cautious outlook on the holiday,” Hasbro Chief Executive Chris Cocks said on a call with analysts. “And I think anyone who says they know how the holiday is going to go, they must have a crystal ball because this has been a tough one to predict.”
Hasbro expects consumers to wait longer to make their purchases and to look for more deals. Some deals are already emerging. Toy prices fell nearly 4% in October from a year earlier, the Labor Department said.
Consumer concerns emerge
Shoppers are facing a number of headwinds that threaten to curtail holiday cheer this year.
Hiring slowed sharply in October and the unemployment rate has risen this year. Paying down credit-card bills is more difficult with interest rates at two-decade highs, and student-loan payments resumed for millions of borrowers. Consumer sentiment in November fell to the lowest level in six months, the University of Michigan said Wednesday.
Americans’ downer attitudes on the economy might not transfer to slashed spending. Many economists saw signs that elevated interest rates would cause consumers to ease up earlier this year. Instead, they spent lavishly, causing economic growth to accelerate.
“Overall, the consumer has been very resilient: that’s why we’re not in a recession,” said Sucharita Kodali, a retail analyst at Forrester.
Nguyen, the owner of Building Blocks, remains optimistic about this holiday season. “People don’t cut out their children,” she said. “Even if they have job insecurity, or worry about food costs,” they still buy gifts for their children, she added.
—Anthony DeBarros contributed to this article.
 Copyright 2020, Dow Jones & Company, Inc. All Rights Reserved Worldwide. LEARN MORE


From snow-dusted valleys to festival-filled autumns, Bhutan reveals itself as a rare destination where culture, nature and spirituality unfold year-round.
Odd Culture Group brings a new kind of after-dark energy to the CBD, where daiquiris, disco and design collide beneath the city streets.


The lunar flyby would be the deepest humans have traveled in space in decades.
4 min
It’s go time for the highest-stakes mission at NASA in more than 50 years.
On April 1, the agency is set to launch four astronauts around the moon, the deepest human spaceflight since the final Apollo lunar landing in 1972.
The launch window for Artemis II , as the mission is called, opens at 6:24 p.m. ET.
National Aeronautics and Space Administration teams have been preparing the vehicles to depart from Florida’s Kennedy Space Center on the planned roughly 10-day trip. Crew members have trained for years for this moment.
Reid Wiseman, the NASA astronaut serving as mission commander, said he doesn’t fear taking the voyage. A widower, he does worry at times about what he is putting his daughters through.
“I could have a very comfortable life for them,” Wiseman said in an interview last September.
“But I’m also a human, and I see the spirit in their eyes that is burning in my soul too. And so we’ve just got to never stop going.”
Wiseman’s crewmates on Artemis II are NASA’s Victor Glover and Christina Koch, as well as Canadian Space Agency astronaut Jeremy Hansen.

What are the goals for Artemis II?
The biggest one: Safely fly the crew on vehicles that have never carried astronauts before.
The towering Space Launch System rocket has the job of lofting a vehicle called Orion into space and on its way to the moon.
Orion is designed to carry the crew around the moon and back. Myriad systems on the ship—life support, communications, navigation—will be tested with the astronauts on board.
SLS and Orion don’t have much flight experience. The vehicles last flew in 2022, when the agency completed its uncrewed Artemis I mission .
How is the mission expected to unfold?
Artemis II will begin when SLS takes off from a launchpad in Florida with Orion stacked on top of it.
The so-called upper stage of SLS will later separate from the main part of the rocket with Orion attached, and use its engine to set up the latter vehicle for a push to the moon.
After Orion separates from the upper stage, it will conduct what is called a translunar injection—the engine firing that commits Orion to soaring out to the moon. It will fly to the moon over the course of a few days and travel around its far side.
Orion will face a tough return home after speeding through space. As it hits Earth’s atmosphere, Orion will be flying at 25,000 miles an hour and face temperatures of 5,000 degrees as it slows down. The capsule is designed to land under parachutes in the Pacific Ocean, not far from San Diego.

Is it possible Artemis II will be delayed?
Yes.
For safety reasons, the agency won’t launch if certain tough weather conditions roll through the Cape Canaveral, Fla., area. Delays caused by technical problems are possible, too. NASA has other dates identified for the mission if it doesn’t begin April 1.
Who are the astronauts flying on Artemis II?
The crew will be led by Wiseman, a retired Navy pilot who completed military deployments before joining NASA’s astronaut corps. He traveled to the International Space Station in 2014.
Two other astronauts will represent NASA during the mission: Glover, an experienced Navy pilot, and Koch, who began her career as an electrical engineer for the agency and once spent a year at a research station in the South Pole. Both have traveled to the space station before.
Hansen is a military pilot who joined Canada’s astronaut corps in 2009. He will be making his first trip to space.
Koch’s participation in Artemis II will mark the first time a woman has flown beyond orbits near Earth. Glover and Hansen will be the first African-American and non-American astronauts, respectively, to do the same.
What will the astronauts do during the flight?
The astronauts will evaluate how Orion flies, practice emergency procedures and capture images of the far side of the moon for scientific and exploration purposes (they may become the first humans to see parts of the far side of the lunar surface). Health-tracking projects of the astronauts are designed to inform future missions.
Those efforts will play out in Orion’s crew module, which has about two minivans worth of living area.
On board, the astronauts will spend about 30 minutes a day exercising, using a device that allows them to do dead lifts, rowing and more. Sleep will come in eight-hour stretches in hammocks.
There is a custom-made warmer for meals, with beef brisket and veggie quiche on the menu.
Each astronaut is permitted two flavored beverages a day, including coffee. The crew will hold one hourlong shared meal each day.
The Universal Waste Management System—that’s the toilet—uses air flow to pull fluid and solid waste away into containers.
What happens after Artemis II?
Assuming it goes well, NASA will march on to Artemis III, scheduled for next year. During that operation, NASA plans to launch Orion with crew members on board and have the ship practice docking with lunar-lander vehicles that Elon Musk’s SpaceX and Jeff Bezos’ Blue Origin have been developing. The rendezvous operations will occur relatively close to Earth.
NASA hopes that its contractors and the agency itself are ready to attempt one or more lunar landing missions in 2028. Many current and former spaceflight officials are skeptical that timeline is feasible.

Many of the most-important events have slipped from our collective memories. But their impacts live on.

From gorilla encounters in Uganda to a reimagined Okavango retreat, Abercrombie & Kent elevates its African journeys with two spectacular lodge transformations.