Which Stocks Do Best During High Inflation?
Kanebridge News
    HOUSE MEDIAN ASKING PRICES AND WEEKLY CHANGE     Sydney $1,643,886 (+0.13%)       Melbourne $988,526 (+0.18%)       Brisbane $1,027,262 (+0.59%)       Adelaide $921,236 (-1.53%)       Perth $913,258 (-0.37%)       Hobart $750,852 (+0.44%)       Darwin $705,508 (+1.52%)       Canberra $959,740 (+0.41%)       National $1,061,930 (+0.08%)                UNIT MEDIAN ASKING PRICES AND WEEKLY CHANGE     Sydney $765,156 (-0.86%)       Melbourne $497,287 (-0.04%)       Brisbane $603,986 (-2.12%)       Adelaide $458,533 (-0.76%)       Perth $487,745 (-0.55%)       Hobart $518,973 (+0.20%)       Darwin $390,036 (-1.70%)       Canberra $500,797 (-0.20%)       National $548,954 (-0.83%)                HOUSES FOR SALE AND WEEKLY CHANGE     Sydney 13,017 (+305)       Melbourne 16,861 (+38)       Brisbane 8,920 (+94)       Adelaide 2,683 (+93)       Perth 7,123 (+134)       Hobart 1,216 (+27)       Darwin 285 (0)       Canberra 1,288 (+65)       National 51,393 (+756)                UNITS FOR SALE AND WEEKLY CHANGE     Sydney 10,097 (-39)       Melbourne 9,079 (+75)       Brisbane 1,777 (+28)       Adelaide 464 (+11)       Perth 1,635 (+53)       Hobart 208 (+6)       Darwin 331 (+3)       Canberra 1,135 (+25)       National 24,726 (+162)                HOUSE MEDIAN ASKING RENTS AND WEEKLY CHANGE     Sydney $800 ($0)       Melbourne $600 ($0)       Brisbane $640 ($0)       Adelaide $600 ($0)       Perth $675 (+$5)       Hobart $550 ($0)       Darwin $750 (-$10)       Canberra $680 ($0)       National $671 (-$1)                UNIT MEDIAN ASKING RENTS AND WEEKLY CHANGE     Sydney $740 (+$8)       Melbourne $560 ($0)       Brisbane $620 ($0)       Adelaide $490 ($0)       Perth $620 ($0)       Hobart $450 ($0)       Darwin $570 (+$20)       Canberra $550 ($0)       National $587 (+$4)                HOUSES FOR RENT AND WEEKLY CHANGE     Sydney 5,925 (+132)       Melbourne 7,088 (+56)       Brisbane 4,248 (+25)       Adelaide 1,340 (-39)       Perth 2,195 (-79)       Hobart 227 (-3)       Darwin 116 (+4)       Canberra 507 (-8)       National 21,646 (+88)                UNITS FOR RENT AND WEEKLY CHANGE     Sydney 9,513 (+76)       Melbourne 6,738 (+50)       Brisbane 2,310 (+70)       Adelaide 375 (+1)       Perth 609 (+11)       Hobart 102 (+3)       Darwin 260 (+16)       Canberra 699 (-41)       National 20,606 (+186)                HOUSE ANNUAL GROSS YIELDS AND TREND         Sydney 2.53% (↓)       Melbourne 3.16% (↓)       Brisbane 3.24% (↓)     Adelaide 3.39% (↑)      Perth 3.84% (↑)        Hobart 3.81% (↓)       Darwin 5.53% (↓)       Canberra 3.68% (↓)       National 3.29% (↓)            UNIT ANNUAL GROSS YIELDS AND TREND       Sydney 5.03% (↑)      Melbourne 5.86% (↑)      Brisbane 5.34% (↑)      Adelaide 5.56% (↑)      Perth 6.61% (↑)        Hobart 4.51% (↓)     Darwin 7.60% (↑)      Canberra 5.71% (↑)      National 5.56% (↑)             HOUSE RENTAL VACANCY RATES AND TREND       Sydney 0.8% (↑)      Melbourne 0.7% (↑)      Brisbane 0.7% (↑)      Adelaide 0.4% (↑)      Perth 0.4% (↑)      Hobart 0.9% (↑)      Darwin 0.8% (↑)      Canberra 1.0% (↑)      National 0.7% (↑)             UNIT RENTAL VACANCY RATES AND TREND       Sydney 0.9% (↑)      Melbourne 1.1% (↑)      Brisbane 1.0% (↑)      Adelaide 0.5% (↑)      Perth 0.5% (↑)      Hobart 1.4% (↑)      Darwin 1.7% (↑)      Canberra 1.4% (↑)      National 1.1% (↑)             AVERAGE DAYS TO SELL HOUSES AND TREND       Sydney 29.4 (↑)      Melbourne 31.4 (↑)        Brisbane 31.4 (↓)     Adelaide 24.8 (↑)      Perth 36.0 (↑)      Hobart 30.1 (↑)        Darwin 40.3 (↓)       Canberra 28.9 (↓)     National 31.5 (↑)             AVERAGE DAYS TO SELL UNITS AND TREND       Sydney 30.0 (↑)      Melbourne 32.2 (↑)        Brisbane 31.1 (↓)     Adelaide 23.4 (↑)        Perth 36.2 (↓)     Hobart 32.4 (↑)      Darwin 42.6 (↑)        Canberra 36.0 (↓)     National 33.0 (↑)            
Share Button

Which Stocks Do Best During High Inflation?

A look at past inflationary periods offers clues on where to invest.

By DEREK HORSTMEYER
Mon, Jun 6, 2022 1:10pmGrey Clock 2 min

Investors commonly hear that when inflation surges, it is best to put your money into physical assets that track the jump in prices, with real estate often suggested as the best option. But physical assets, particularly properties, generally can’t be bought as easily or quickly as securities, and acquiring them often entails significant transaction costs.

The second-best option is usually to rebalance your stock portfolio to shift it into industries that do well in an inflationary environment. So, when inflation surges, what industries do best for a stock portfolio?

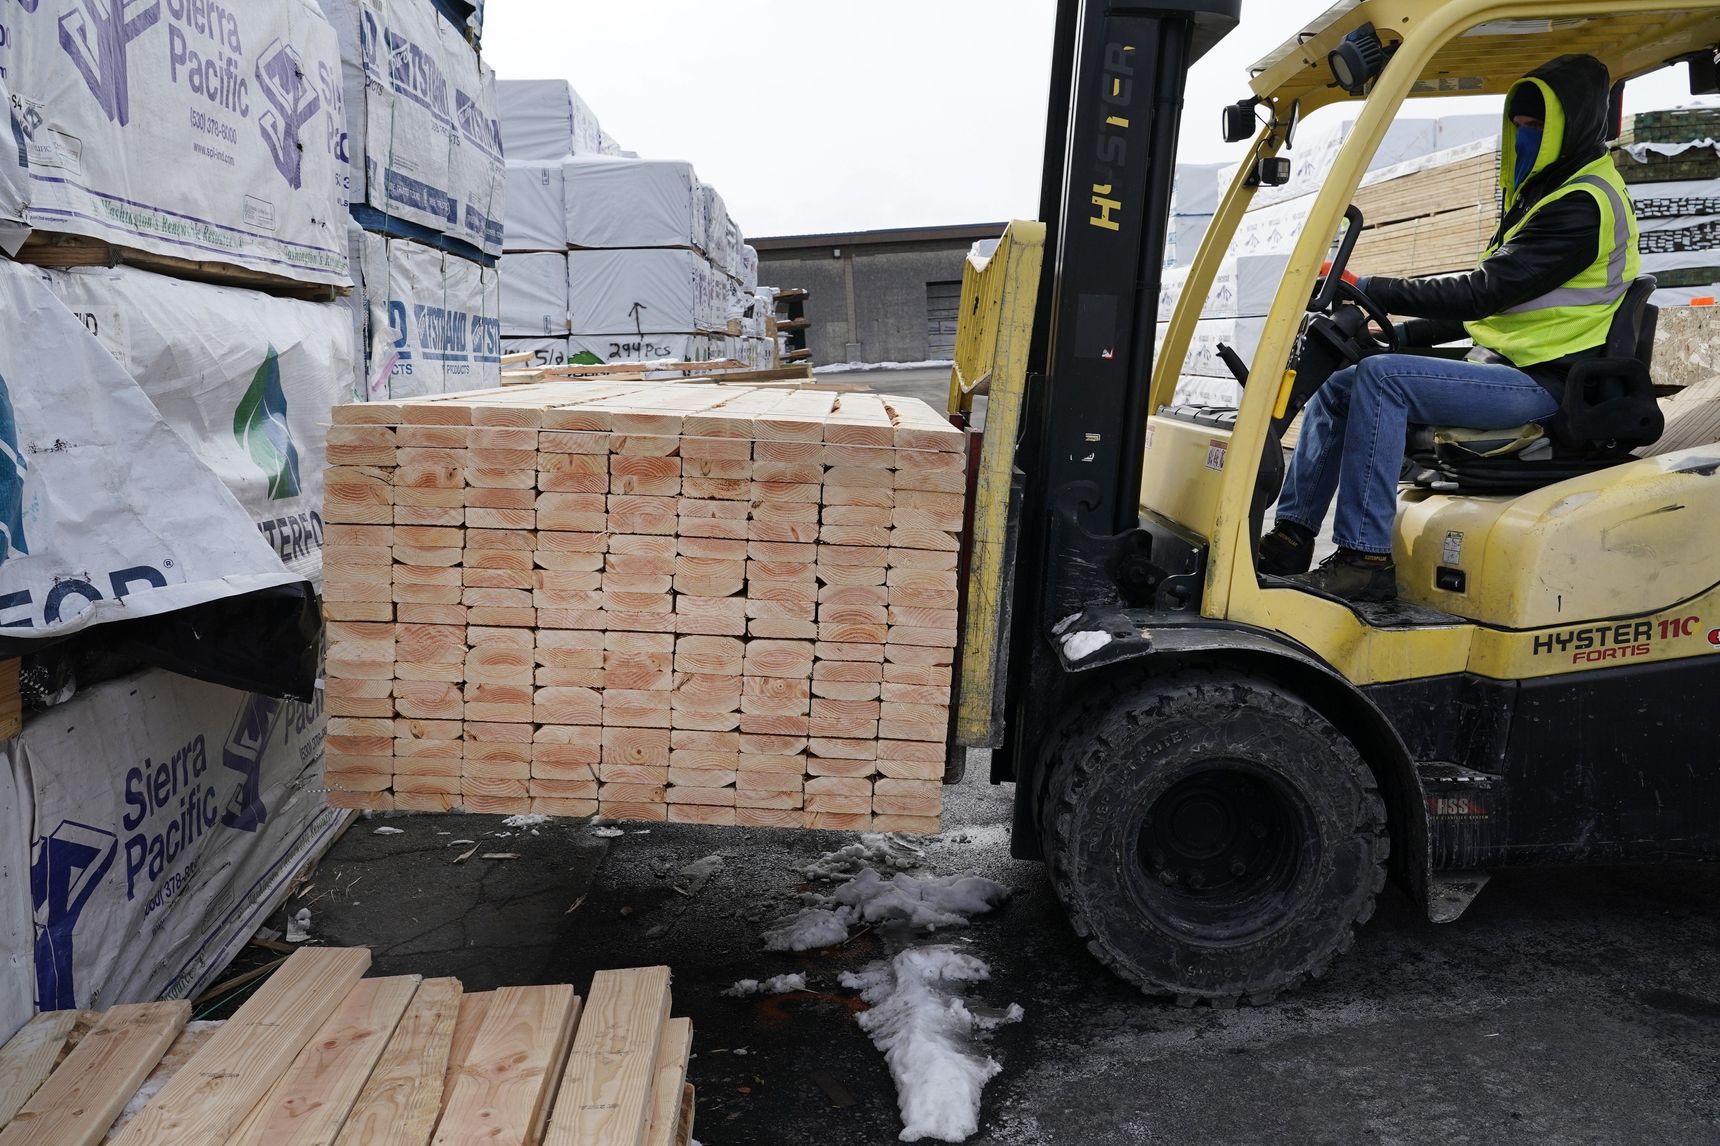
To sum up: Shares in real-estate investment trusts or companies in the real-estate industry are not the best option. Stocks in the materials and energy industries outperform all others by a long shot, according to the findings of a study I conducted with my research assistants, Zihan Chen and Yiming Xie.

We gathered data on the returns for all stocks listed on the New York Stock Exchange or Nasdaq over the past 50 years. We then examined the course of the consumer-price index over those years and found three spikes in prices during which the inflation rate doubled in less than 24 months: March 1973 to May 1975, April 1978 to September 1980, and February 2021 to March 2022.

We separated each company in our data set into one of 10 industries, and examined how the median stock in each industry, in terms of returns, performed during those three periods of surging inflation.

The median real-estate stock delivered a 3.32% annualized return over the three periods, far below the annualized returns of 18% for the median energy company and 16.81% for the median materials company.

On the opposite end of the spectrum, healthcare (including pharmaceuticals) performed the worst, with an annualized return of minus 8.44%, followed by consumer staples at minus 6.73%, consumer discretionary at minus 5.71%, utilities at minus 4% and technology at minus 3.64%.

The negative results for healthcare, tech and consumer discretionary are understandable, because these are interest-rate-sensitive industries. But the results for consumer staples and utilities might surprise some investors, because these are often thought of as safe assets in rough times.

At the end of the day, the best move for investors who want to reposition their portfolios quickly when inflation is surging is to shift into materials and energy companies.


MOST POPULAR
11 ACRES ROAD, KELLYVILLE, NSW

This stylish family home combines a classic palette and finishes with a flexible floorplan

35 North Street Windsor

Just 55 minutes from Sydney, make this your creative getaway located in the majestic Hawkesbury region.

Related Stories
Money
The cost of friendship: why Australian social circles are shrinking
By KANEBRIDGE NEWS 22/10/2024
Money
The Generosity Power Move That Can Boost Your Career
By RACHEL FEINTZEIG 22/10/2024
Money
Behind Many Powerful Women on Wall Street: A Doting ‘Househusband’
By MIRIAM GOTTFRIED 22/10/2024
The cost of friendship: why Australian social circles are shrinking

More than one fifth of Australians are cutting back on the number of people they socialise with

By KANEBRIDGE NEWS
Tue, Oct 22, 2024 < 1 min

Australian social circles are shrinking as more people look for ways to keep a lid on spending, a new survey has found.

New research from Finder found more than one fifth of respondents had dropped a friend or reduced their social circle because they were unable to afford the same levels of social activity. The survey questioned 1,041 people about how increasing concerns about affordability were affecting their social lives. The results showed 6 percent had cut ties with a friend, 16 percent were going out with fewer people and 26 percent were going to fewer events. 

Expensive events such as hens’ parties and weddings were among the activities people were looking to avoid, indicating younger people were those most feeling the brunt of cost of living pressures. According to Canstar, the average cost of a wedding in NSW was between $37,108 to $41,245 and marginally lower in Victoria at $36, 358 to $37,430.

But not all age groups are curbing their social circle. While the survey found that 10 percent of Gen Z respondents had cut off a friend, only 2 percent of Baby Boomers had done similar.

Money expert at Finder, Rebecca Pike, said many had no choice but to prioritise necessities like bills over discretionary activities.

“Unfortunately, for some, social activities have become a luxury they can no longer afford,” she said.

MOST POPULAR
11 ACRES ROAD, KELLYVILLE, NSW

This stylish family home combines a classic palette and finishes with a flexible floorplan

35 North Street Windsor

Just 55 minutes from Sydney, make this your creative getaway located in the majestic Hawkesbury region.

Related Stories
Property
Swapping Your Home for a Vacation? What You Need to Know
By ALLISON POHLE 05/07/2024
Money
Global Charities Say Using Companies’ Carbon Offsets to Lower Emissions Undermines Climate Targets
By YUSUF KHAN 04/07/2024
Money
Let’s ‘Double-Click’ on the Latest Cringeworthy Corporate Buzzword
By TE-PING CHEN 11/07/2024
0
    Your Cart
    Your cart is emptyReturn to Shop