Why Family Offices Are Emerging as Preferred Partners for CRED Managers
As Australia’s family offices expand their presence in private credit, a growing number of commercial real estate debt (CRED) managers are turning to them as flexible, strategic funding partners.
 3 min
3 min
Family offices are increasingly asserting their dominance in Australia’s private credit markets, particularly in the commercial real estate debt (CRED) segment.
With more than 2,000 family offices now operating nationally—an increase of over 150% in the past decade, according to KPMG—their influence is not only growing in scale, but also in strategic sophistication.
Traditionally focused on preserving intergenerational wealth, COI Capital has found that family offices have broadened their mandates to include more active and yield-driven deployment of capital, particularly through private credit vehicles.
This shift is underpinned by a defensive allocation rationale: enhanced risk-adjusted returns, predictable income, and collateral-backed structures offer an attractive alternative to the volatility of public markets.
The Competitive Landscape for Manager Mandates
As family offices increase their exposure to private credit, the dynamic between managers and capital providers is evolving. Family offices are highly discerning capital allocators.
They expect enhanced reporting, real-time visibility into asset performance, and access to decision-makers are key differentiators for successful managers. Co-investment rights, performance-based fees, and downside protection mechanisms are increasingly standard features.
While typically fee-sensitive, many family offices are willing to accept standard management and performance fee structures when allocating $5M+ tickets, recognising the sourcing advantage and risk oversight provided by experienced managers. This has created a tiered market where only managers with demonstrated execution capability, origination networks, and robust governance frameworks are considered suitable partners.
Notably, many are competing by offering differentiated access models, such as segregated mandates, debt tranches, or tailored securitisation vehicles.
Onshore vs. Offshore Family Offices
There are important distinctions between onshore and offshore family offices in the context of CRED participation:
-
Onshore Family Offices: Typically have deep relationships with local stakeholders (brokers, valuers, developers) and a more intuitive understanding of planning, legal, and enforcement frameworks in Australian real estate markets. They are more likely to engage directly or via specialised mandates with domestic managers.
-
Offshore Family Offices: While often attracted to the yield premium and legal protections offered in Australia, they face structural barriers in accessing deal flow. Currency risk, tax treatment, and regulatory unfamiliarity are key concerns. However, they bring diversification and scale, often via feeder vehicles, special-purpose structures, or syndicated participation with Tier 1 managers.
COI Capital Management has both an offshore and onshore strategy to assist and suit both distinct Family Office needs.

Impact on the Broader CRED Market
The influx of family office capital into private credit markets has several systemic implications:
-
Family offices, deploying capital in significant tranches, have enhanced liquidity across the mid-market CRE sector.
-
Their ability to move quickly with minimal conditionality has contributed to yield compression, particularly on low-LVR, income-producing assets.
-
As a few family offices dominate large allocations, concerns emerge around pricing power, governance, and systemic concentration risk.
Unlike ADIs or superannuation funds, family offices operate outside the core prudential framework, raising transparency and risk management questions, particularly in a stress scenario.
So what is the answer? Are Family Offices the most Attractive?
Yes—family offices are arguably among the most attractive funding partners for CRED managers today. Their capital is not only flexible and long-term focused, but also often deployed with a strategic mindset.
Many family offices now have a deep understanding of the risk-return profile of CRE debt, making them highly engaged and informed investors.
They’re typically open to co-investment, bespoke structuring, and are less bogged down by institutional red tape, allowing them to move quickly and decisively when the right opportunity presents itself. For managers, this combination of agility, scale, and sophistication makes them a valuable and increasingly sought-after partner in the private credit space.
For high-performing CRED managers with demonstrable origination, governance, and reporting frameworks, family offices offer not only a reliable source of capital but also a collaborative partnership model capable of supporting large-scale deployments across market cycles.
Faris Dedic is the Founder and Managing Director of DIG Capital Advisory and COI Capital Management

Set on one of the city’s last absolute riverfront sites, The Riversdale by Mosaic combines irreplaceable waterfront ownership with one of Brisbane’s most significant residential opportunities.
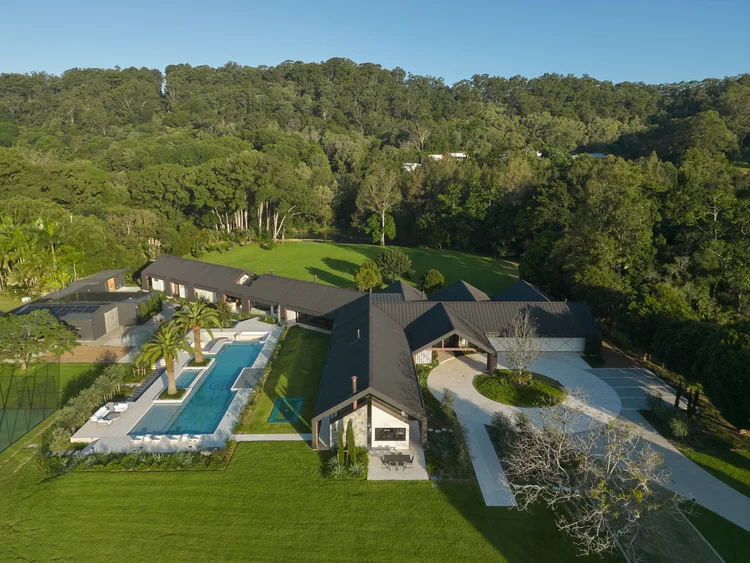
Margot Robbie may have travelled from a Queensland farm to the highest reaches of Hollywood, but a reported $28 million property deal suggests the Gold Coast has never lost its hold on her. The Australian actor and producer is believed to be the mystery buyer of Redwood, a seven-acre Currumbin Valley estate transformed into the …
Continue reading “Margot Robbie Reportedly Behind $28 Million Currumbin Valley Homecoming”


The federal budget has rattled property investors. But the biggest mistake isn’t the tax changes, it’s the conclusion many are drawing from them.
2 min
The recent budget has forced a reckoning for property investors.
Negative gearing now restricted to new residential builds, the CGT discount gone and on paper, the numbers look different.
And many investors are responding by pivoting toward yield, prioritising cash flow over capital growth in a way that property strategists say misses the point entirely.
“The debate has shifted to yield versus growth as if they are opposing forces,” says Abdullah Nouh, founder of Melbourne-based buyers’ agency Mecca Property Group. “But that framing is itself the mistake.”
Nouh, who works with high-net-worth families and investors on long-term acquisition strategy, argues that capital growth remains the primary driver of genuine wealth creation and that the post-budget environment has made quality assets more important, not less.
The numbers make his case plainly. An additional $500 per week in rental income is welcome. A prestige asset appreciating by $1 million over a market cycle is transformative.
These are not equivalent outcomes, and portfolios built around yield at the expense of location and land value tend to generate income while wealth stands largely still.
The more nuanced shift Nouh is seeing among sophisticated investors is a move toward assets where both outcomes can be engineered simultaneously – established homes on substantial land in quality locations, where the existing dwelling can be repositioned, rental returns improved, and the underlying land value compounds independent of what sits on it.
For investors with existing equity, commercial property is also entering the conversation in a more serious way.
Prestige industrial assets, medical centres and long-leased essential retail offer income profiles that residential property in most capital city markets cannot currently match: longer lease terms, tenants covering outgoings, and greater predictability than the residential tenancy cycle.
“The investors who build lasting wealth are rarely the ones who chased yield or growth exclusively,” says Nouh.
“They are the ones who built a strategy they could sustain – one that generated enough income to hold quality assets through multiple cycles while those assets compounded in value.”
The budget has changed the settings. It has not changed the fundamentals.

From the shacks of yesterday to the sculptural sanctuaries of today, Australia’s coastal architecture has matured into a global benchmark for design.
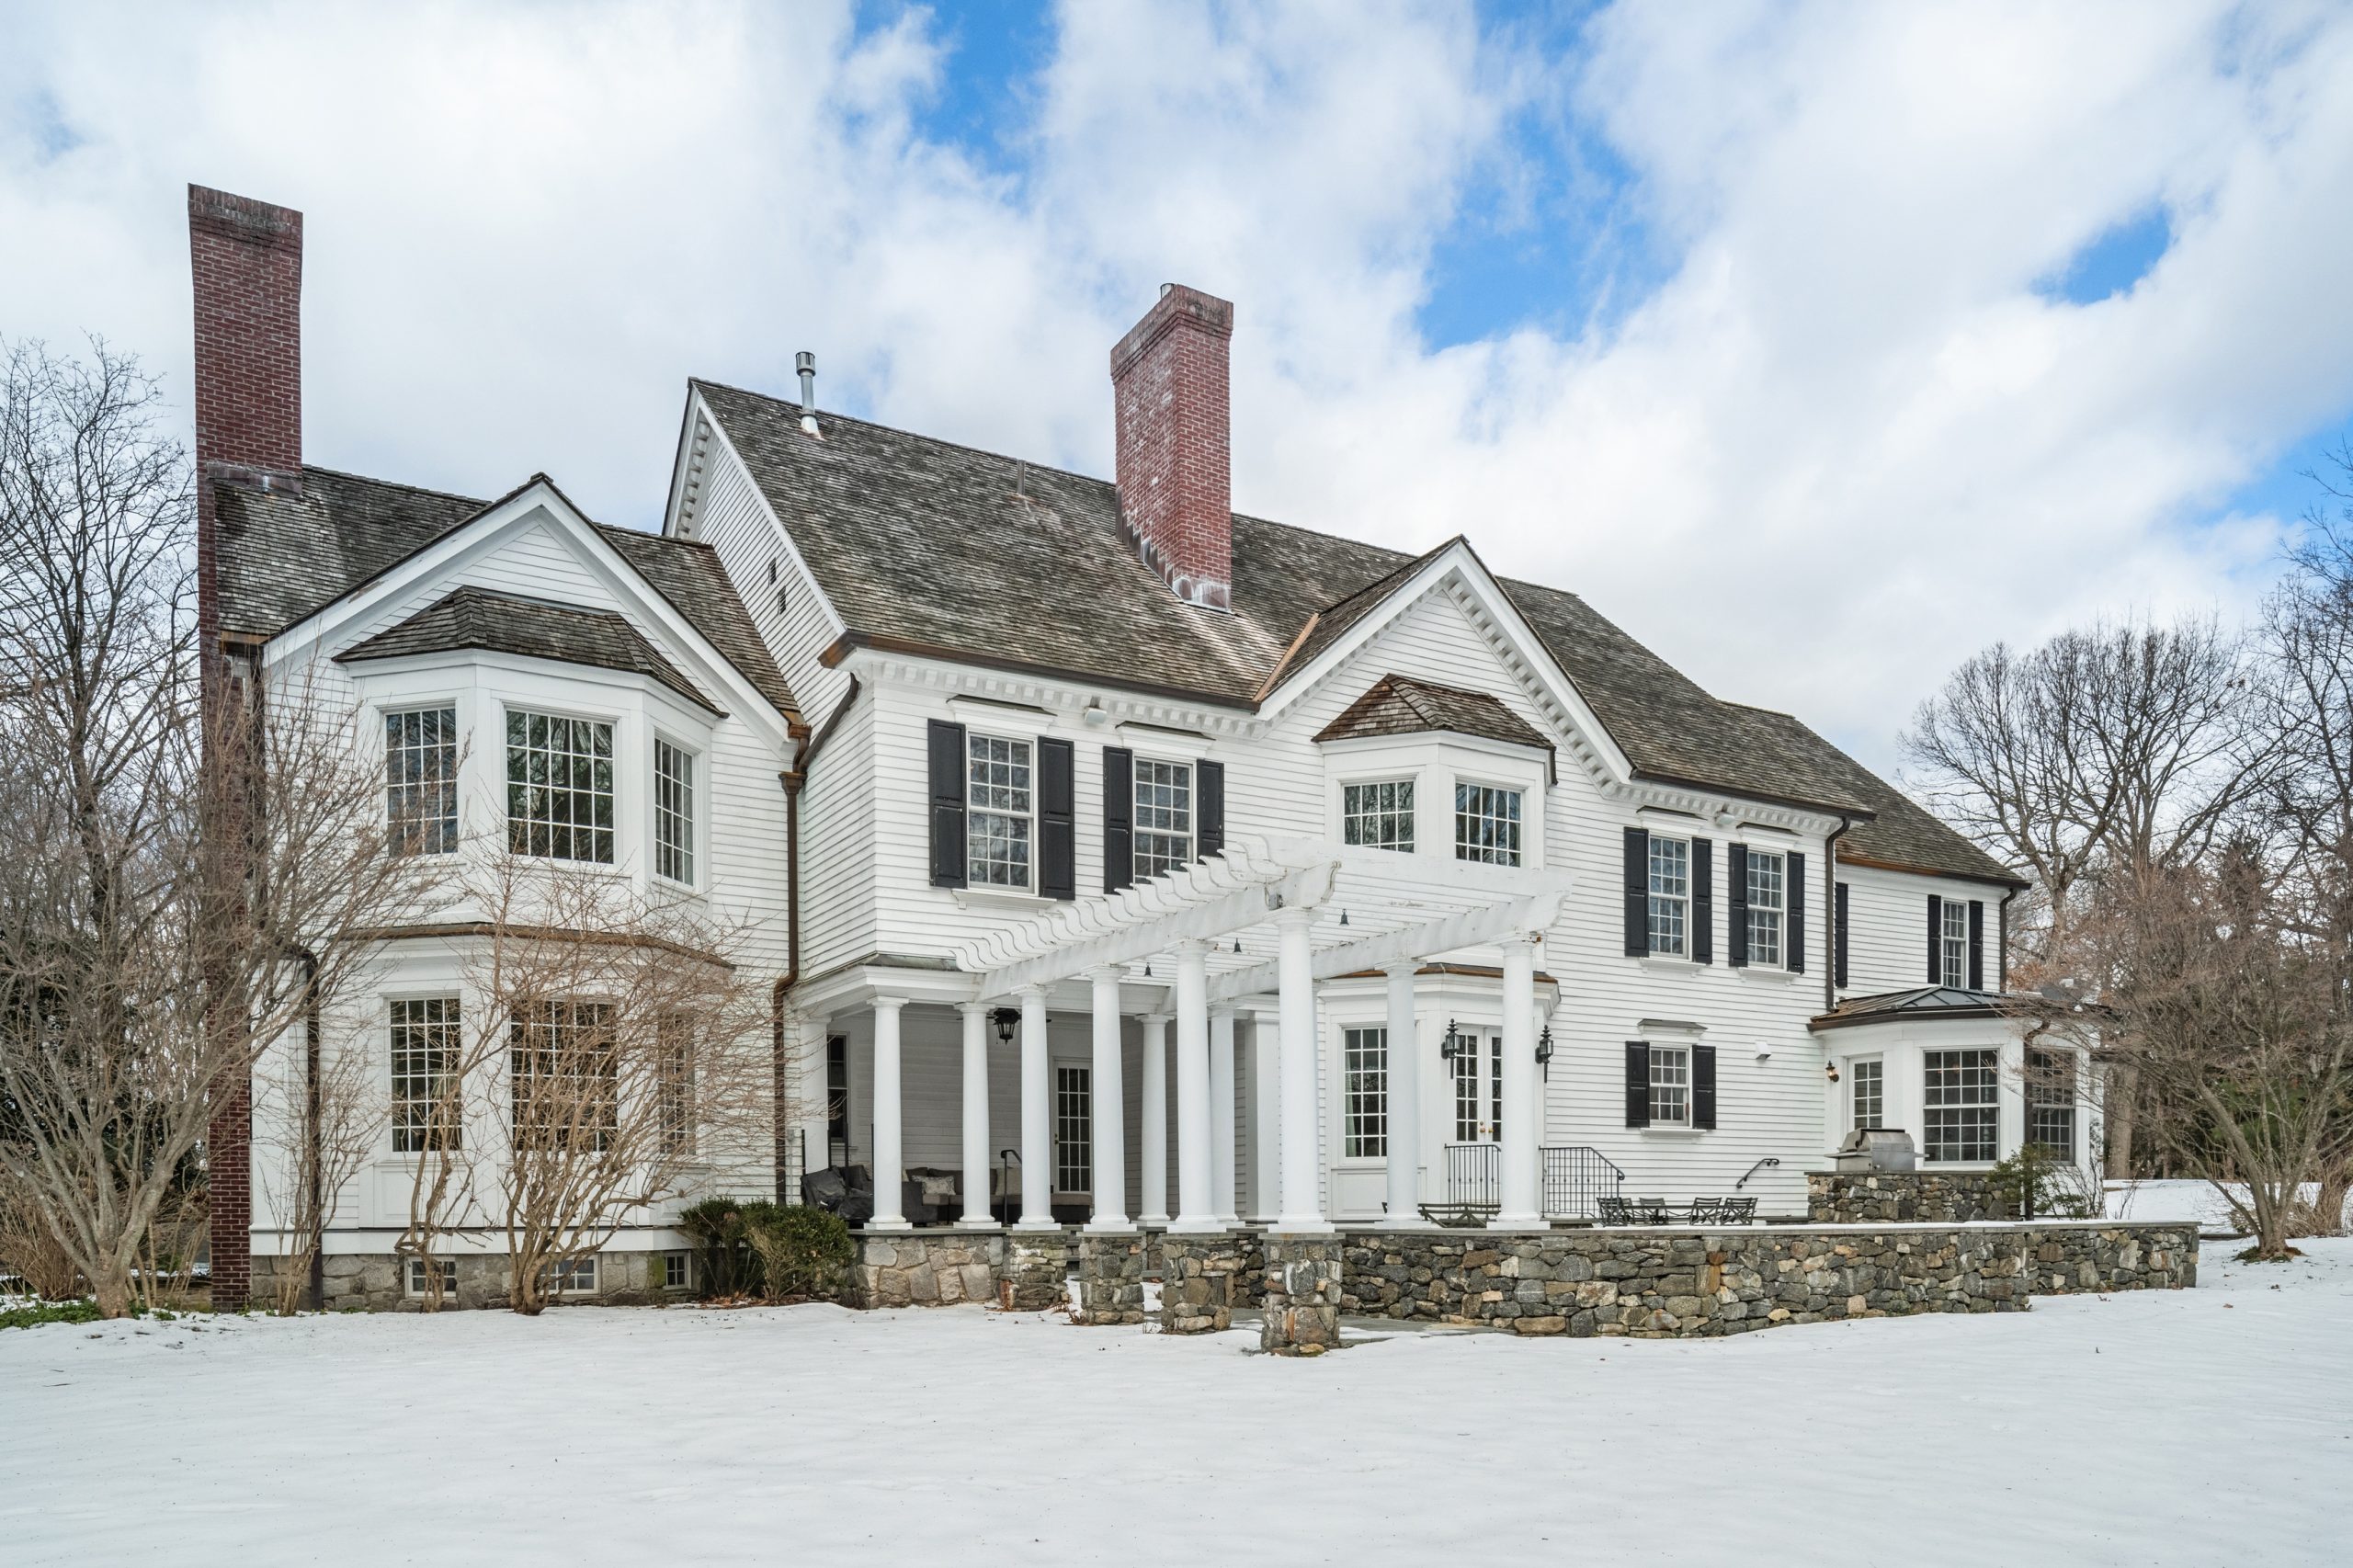
A haven for hedge-fund titans and Hollywood grandees, Greenwich is one of the world’s most expensive residential enclaves, where eye-watering prices meet unapologetic grandeur.