Why Is Everyone So Unhappy at Work Right Now?
U.S. employees are more dissatisfied than they were in the thick of the pandemic

 5 min
5 min")
Americans, by many measures, are unhappier at work than they have been in years.
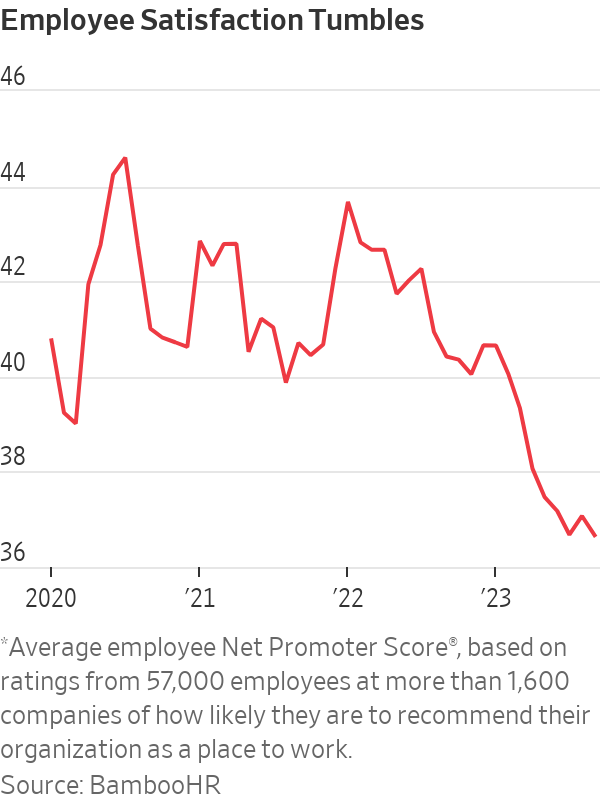
Despite wage increases, more paid time off and greater control over where they work, the number of U.S. workers who say they are angry, stressed and disengaged is climbing, according to Gallup’s 2023 workplace report. Meanwhile, a BambooHR analysis of data from more than 57,000 workers shows job-satisfaction scores have fallen to their lowest point since early 2020, after a 10% drop this year alone.
In interviews with workers around the country, it is clear the unhappiness is part of a rethinking of work life that began in 2020. The sources of workers’ discontent range from inflation, which is erasing much of recent pay gains, to the still-unsettled nature of the workday. People chafe against being micromanaged back to offices, yet they also find isolating aspects of hybrid and remote work. A cooling job market—especially in white-collar roles—is leaving many professionals feeling stuck.
Companies have largely moved on from pandemic operating mode, cutting costs and renewing a focus on productivity. The disconnect with workers has managers frustrated, and no quick fix seems to be at hand. Those in charge said they have given staff more money, flexibility and support, only to come up short.
The experiences of workers like Lindsey Leesmann suggest how expectations have shifted from just a few years ago. Leesmann, 38 years old, said she soured on a philanthropy job after having to return to the office two days a week earlier this year.
Prepandemic, she would have been happy working three days a week at home. “It would have been a dream come true.” Still, her team’s in-office requirements seemed like going backward, and made her feel that her professionalism and work quality were in doubt. Instead of collaborating more, she and others rarely left their desks, except for meetings or lunch, she said. Negative feelings followed her home on her hourlong commute, leaving her short-tempered with her kids.
“You try to keep work and home separate, but that sort of stuff is just impacting your mental health so much,” said Leesmann, who recently moved to a new job that requires five in-office days a month.
No more honeymoon
The discontent has business leaders struggling for answers, said Stephan Scholl, chief executive of Alight Solutions, a technology company focused on benefits and payroll administration. Many of the Fortune 100 companies on Alight’s client list boosted spending on employee benefits such as mental health, child care and well-being bonuses by 20% over the pandemic years.
“All that extra spend has not translated into happier employees,” Scholl said. In an Alight survey of 2,000 U.S. employees this year, 34% said they often dread starting their workday—an 11-percentage-point rise since 2020. Corporate clients have told him mental-health claims and costs from employee turnover are rising.
One factor is the share of workers who are relatively new to their roles after record levels of job-switching, said Benjamin Granger, chief workplace psychologist at software company Qualtrics. Many employers have focused more on hiring than situating new employees well, leaving many newbies feeling adrift. In other cases, workers discovered shiny-seeming new jobs weren’t a great fit.
The upshot is that the newest workers are among the least satisfied, Qualtrics data show—a reversal of the higher levels of enthusiasm that fresh hires typically voice. In its study of nearly 37,000 workers published last month, people less than six months into a job reported lower levels of engagement, feelings of inclusion and intent to stay than longer-tenured workers. They also scored lower on those metrics than new workers in 2022, suggesting the pay raises that lured many people to new jobs might not be as satisfying as they were a year or two ago.
“What happened to that honeymoon phase?” Granger said.
John Shurr, a 66-year-old former manufacturing engineer, took a job as an inventory manager at a heavy-equipment retailer in the spring in Missoula, Mont., after being laid off during the pandemic.
“It was a nice job title on a pretty rotten job,” said Shurr, who learned soon after starting that his duties would also include sales to walk-in customers.
When Shurr broached the subject, his boss asked him to give it a chance and said he was really needed on the showroom floor. Shurr, who describes himself as more of a computer guy, quit about a month later.
“I feel kind of trapped at the moment,” said Shurr, who has since taken a part-time job as a parts manager as he tries to find full-time work.
Bridging the distance
Long-distance relationships between bosses and staff might also be an issue. Nearly a third of workers at large firms don’t work in the same metro area as their managers, up from about 23% in February 2020, according to data from payroll provider ADP.
Distance has weakened ties among co-workers and heightened conflict, said Moshe Cohen, a mediator and negotiation coach who teaches conflict resolution at Boston University’s Questrom School of Business. He has noticed more employees calling co-workers or bosses toxic or impossible, signs that trust is thin.
Cohen’s corporate clients said their employees are increasingly transactional with one another. Some are coaching workers in the finer points of dialogue, such as saying hello first before jumping into the substance of a conversation.
“The idea of slowing down, taking the time, being genuine, trying to actually establish some sort of connection with the other person—that’s really missing,” Cohen said.
One Los Angeles-based consultant in his 20s, who asked to remain anonymous because he is seeking another job, said that when he started his job at a large company last year, his largely remote colleagues were focused on their own work, unwilling to show a new hire the ropes or invite him for coffee. Many leave cameras off for video calls and few people show up at the office, making it hard to build relationships.
“There’s zero humanity,” he said, noting that he is seeking another job with a strong office culture.
The share of U.S. companies mandating office attendance five days a week has fallen this year—to 38% in October from 49% at the start of the year—according to Scoop Technologies, a software firm that developed an index to monitor workplace policies of nearly 4,500 companies.
Some companies have reversed flexible remote-work policies—in large part, they said, to boost employee engagement and productivity—only to face worker backlash.
Not all the data point downward. A Conference Board survey in November 2022 of U.S. adults showed workers were more satisfied with their jobs than they had been in years. Key contingents among the happiest employees: people who voluntarily switched roles during the pandemic and those working a mix of in-person and remote days. But that poll was taken before a spate of layoffs at high-profile companies and big declines in the number of knowledge-worker and professional jobs advertised.
At Farmers Group, workers posted thousands of mostly negative comments on the insurer’s internal social-media platform after its new CEO nixed the company’s previous policy allowing most workers to be remote.
Employees like Kandy Mimande said they felt betrayed. “We couldn’t get the ‘why,’” said the 43-year-old, who had sold her car and spent thousands of dollars to redo her home office under the remote-work policy. She shelled out $10,000 for a used car for the commute. A company spokesperson said that not all employees will support every business decision and that Farmers hasn’t seen a significant impact on staff retention.
During a brief leave, Mimande realised she no longer felt a sense of purpose from her product-management job. She resigned last month after she and her wife decided they could live on one salary.
She now helps promote a band and pet-sits. “It’s so much easier for me to report to myself,” she said.
 Copyright 2020, Dow Jones & Company, Inc. All Rights Reserved Worldwide. LEARN MORE


From bushland greens to valley reds, the country’s most awarded designers are proving that the best colour palette was never on a swatch card; it was outside the window all along.

The Australian leather house has opened an immersive four-day pop-up in Manhattan, unveiling its Bloom Collection and redefining what a product launch can look like.


The federal budget has rattled property investors. But the biggest mistake isn’t the tax changes, it’s the conclusion many are drawing from them.
2 min
The recent budget has forced a reckoning for property investors.
Negative gearing now restricted to new residential builds, the CGT discount gone and on paper, the numbers look different.
And many investors are responding by pivoting toward yield, prioritising cash flow over capital growth in a way that property strategists say misses the point entirely.
“The debate has shifted to yield versus growth as if they are opposing forces,” says Abdullah Nouh, founder of Melbourne-based buyers’ agency Mecca Property Group. “But that framing is itself the mistake.”
Nouh, who works with high-net-worth families and investors on long-term acquisition strategy, argues that capital growth remains the primary driver of genuine wealth creation and that the post-budget environment has made quality assets more important, not less.
The numbers make his case plainly. An additional $500 per week in rental income is welcome. A prestige asset appreciating by $1 million over a market cycle is transformative.
These are not equivalent outcomes, and portfolios built around yield at the expense of location and land value tend to generate income while wealth stands largely still.
The more nuanced shift Nouh is seeing among sophisticated investors is a move toward assets where both outcomes can be engineered simultaneously – established homes on substantial land in quality locations, where the existing dwelling can be repositioned, rental returns improved, and the underlying land value compounds independent of what sits on it.
For investors with existing equity, commercial property is also entering the conversation in a more serious way.
Prestige industrial assets, medical centres and long-leased essential retail offer income profiles that residential property in most capital city markets cannot currently match: longer lease terms, tenants covering outgoings, and greater predictability than the residential tenancy cycle.
“The investors who build lasting wealth are rarely the ones who chased yield or growth exclusively,” says Nouh.
“They are the ones who built a strategy they could sustain – one that generated enough income to hold quality assets through multiple cycles while those assets compounded in value.”
The budget has changed the settings. It has not changed the fundamentals.

A survey of people with at least $1 million in investable assets found women in their 30s and 40s look nothing like older generations in terms of assets and priorities

A bold new era for Australian luxury: MAISON de SABRÉ launches The Palais, a flagship handbag eight years in the making.