


Beauty Slowdown Reflects Cracks in Consumer Spending
After years of pandemic splurging, Ulta Beauty CEO says pullback is evident across price points and product types

 2 min
2 min
Makers of consumer goods have been bracing for a slowdown in consumer spending after ebullient pandemic times. Ulta Beauty is now saying that the decline is happening faster than it expected.
The entire beauty category is experiencing weaker spending across price points and product segments, said Dave Kimbell , Ulta’s chief executive, at an investor conference Wednesday. The retail chain is among beauty companies that reported strong growth in revenue and profits over the past three years as consumers stepped up purchases of makeup, perfumes and skin-care items.
“Things that are going on in our consumers’ lives has led to a bit slower growth than we had anticipated in the category,” Kimbell said.
Ulta also isn’t expecting much growth in comparable sales in the current quarter from the first quarter last year. Comparable sales reflect sales at Ulta stores open at least 14 months and from e-commerce.
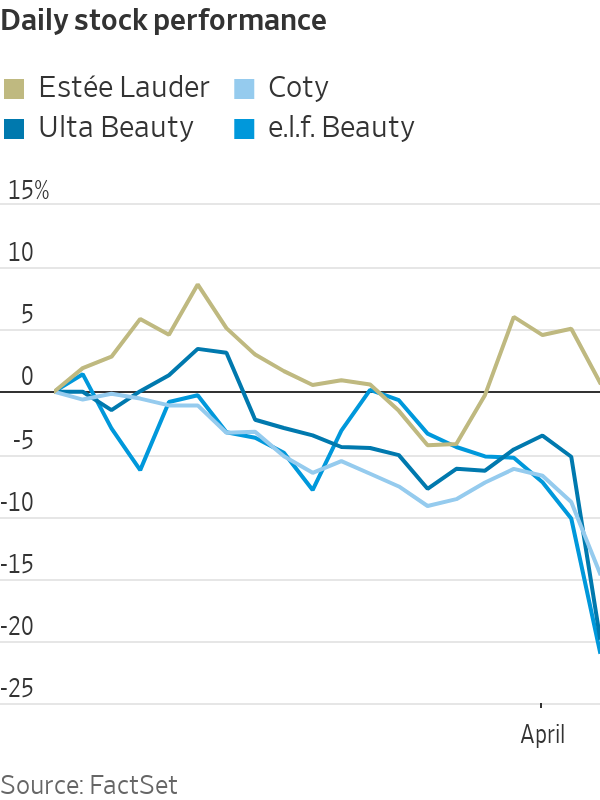
The comments helped send Ulta shares down 15% in Wednesday trading. Other beauty companies, including e.l.f. Beauty , Coty and Estée Lauder , also fell.
Ulta’s shares have lost about a fifth of their value after closing at a record of $567.18 on March 13, the day before the company released its fourth-quarter earnings.
“We do expect a normalisation to occur this year in the category,” said Jessica Ramirez , senior research analyst at Jane Hali & Associates. “However, we believe the consumer will continue to prioritise the beauty category as products across skin care and wellness are replenishable.”
The competitive landscape is also shifting in beauty. Sephora, the LVMH Moët Hennessy Louis Vuitton -owned rival to Ulta, is expanding its bricks-and-mortar presence in Kohl’s stores. Other retailers are also increasing their presence in the beauty business, Ulta executives said. New products are expected to help drive traffic to Ulta, including those from tennis star Serena Williams ’s new line Wyn Beauty, executives said.
U.S. retail sales are expected to rise this year from 2023, but at a slower pace than during the Covid-19 pandemic period, according to the National Retail Federation. The trade group forecast that retail sales would increase between 2.5% and 3.5% this year, just below the 10-year average of 3.6% before the health crisis.
“The foundation of the economy is relatively sturdy and still on a sustainable path,” NRF Chief Economist Jack Kleinhenz said Wednesday. “Barring unexpected shocks, it should continue growing in 2024, although not spectacularly” as a result of slower job and wage gains.
Other consumer-goods companies are bracing for a slowdown. PVH , the company behind brands Calvin Klein and Tommy Hilfiger, said on Tuesday that it has taken a cautious approach to planning in 2024 as a result of softer consumer spending in January and February. It forecast overall revenue this year would fall between 6% and 7% from 2023.
 Copyright 2020, Dow Jones & Company, Inc. All Rights Reserved Worldwide. LEARN MORE


This stylish family home combines a classic palette and finishes with a flexible floorplan

Just 55 minutes from Sydney, make this your creative getaway located in the majestic Hawkesbury region.


A new report on the impact of cost of living pressures reveals a stark contrast between age groups in investment strategies
3 min
Four in five Australians say they have changed their investment and savings goals over the past 12 months, with 44 percent doing so primarily to make ends meet during the cost–of–living crisis. A further 25 percent say they’ve switched strategies to protect their wealth against inflation, according to a new survey by financial advisory firm, Findex.
The Superannuation and Retirement Insights report shows Australians have also changed their goals to grow their wealth (31 percent), to create a regular income stream (29 percent) and to reduce taxes (17 percent). Transferring wealth to their children or other family members has motivated 10 percent of Australians to alter their investment plans, which is likely reflective of the increasing role played by the Bank of Mum and Dad in young people’s first home purchases.
The report found that traditional investment avenues, such as property and superannuation, remain the most popular choices, with more than eight out of 10 survey respondents ranking these asset classes highly. But there is also an increasing inclination towards investments that offer the potential for quicker returns, additional perceived safety, and better liquidity or accessibility to funds.
Eighty percent of survey respondents also nominated bank savings as among their top five investment choices right now, followed by shares (66 percent) and cash (51 percent).
“This shift reflects a broader strategy to mitigate current financial uncertainties, balancing the pursuit of long-term wealth accumulation with the need for immediate financial security,” the report says.
While superannuation is considered a cornerstone investment for retirement and long-term wealth accumulation, 85 percent of Australians are exploring investments outside superannuation. The most common investments outside super are bank savings (64 percent), property (38 percent), cash (35 percent) and shares (34 percent).
However, when the data is broken down by generation, stark differences are revealed in how each age cohort chooses to invest their spare income and why.
Most popular investments outsider super and the motivations to invest by generation
Baby Boomers (born 1965-1964)
Outside superannuation, Baby Boomers prefer to invest in bank savings (60 percent), property (50 percent) and shares (46 percent).
By far, their primary motivation for investing is planning for retirement (80 percent). They also want to build wealth (51 percent) and support their children or other family members (25 percent). Other motivations include preserving wealth to beat inflation (22 percent) and paying off a mortgage or other debt (20 percent). They are the least likely generation to be saving for an investment property.
Gen Xers (born 1965–1980)
Gex Xers prefer to invest in bank savings (57 percent), property (43 percent) and shares (36 percent).
They are motivated to invest for retirement (66 percent), to build wealth (50 percent), to save for emergencies (36 percent), and to pay off a mortgage or other debt (30 percent). Interestingly, Gen X is the generation most concerned with supporting their children or family members (33 percent). This may be because Gen Xers have grown up during Australia’s long-standing property boom that began in the late 1990s and continues today.
Millennials (born 1981-1996)
Millennials have the strongest interest in bank savings as an investment avenue (70 percent), followed by property at 41 percent. They also like cash (35 percent) and shares (33 percent). Millennials have the highest uptake of exchange-traded funds (ETFs) at 21 percent. ETFs are a relatively new type of asset class, with the first ones trading on the ASX in 2001. ETFs are a basket of shares that can be purchased in a single transaction for instant diversification. Millennials are also the generation most interested in cryptocurrencies, with 22 percent invested.
Their biggest motivations for investing are to build wealth (55 percent), save for emergencies (50 percent) and plan for retirement (49 percent). They also want to support their kids (32 percent) and pay off their mortgage (32 percent). Millennials are the generation most likely to be saving for an investment property (28 percent) rather than a first home (17 percent).
Gen Zs (born 1997-2009)
Gen Zs spread their money across more asset classes than their elders. They like investing in bank savings (66 percent), cash (42 percent), shares (22 percent), ETFs (17 percent), property (14 percent) and cryptocurrencies (13 percent).
While Gen Zs are the youngest age cohort within the survey, they also have long-term goals just like their elders. The biggest motivation to invest among Gen Zs is to build wealth (52 percent). More Gen Zs are saving for a first home than any other generation, with 42 percent pursuing this goal. They are also the generation most concerned with preserving wealth to beat inflation (29 percent). Gen Zs also want short-term security, with 46 percent saving for emergencies. They’re also the generation most likely to be saving for other major purchases like a car or holiday (41 percent) and investing just for enjoyment (26 percent).
Just 55 minutes from Sydney, make this your creative getaway located in the majestic Hawkesbury region.

Consumers are going to gravitate toward applications powered by the buzzy new technology, analyst Michael Wolf predicts