To Find Winning Stocks, Investors Often Focus on the Laggards. They Shouldn’t.
These stocks are getting hit for a reason. Instead, focus on stocks that show ‘relative strength.’ Here’s how.

 4 min
4 min
A lot of investors get stock-picking wrong before they even get started: Instead of targeting the top-performing stocks in the market, they focus on the laggards—widely known companies that look as if they are on sale after a period of stock-price weakness.
But these weak performers usually are going down for good reasons, such as for deteriorating sales and earnings, market-share losses or mutual-fund managers who are unwinding positions.
Decades of Investor’s Business Daily research shows these aren’t the stocks that tend to become stock-market leaders. The stocks that reward investors with handsome gains for months or years are more often already the strongest price performers, usually because of outstanding earnings and sales growth and increasing fund ownership.
Of course, many investors already chase performance and pour money into winning stocks. So how can a discerning investor find the winning stocks that have more room to run?
Enter “relative strength”—the notion that strength begets more strength. Relative strength measures stocks’ recent performance relative to the overall market. Investing in stocks with high relative strength means going with the winners, rather than picking stocks in hopes of a rebound. Why bet on a last-place team when you can wager on the leader?
One of the easiest ways to identify the strongest price performers is with IBD’s Relative Strength Rating. Ranked on a scale of 1-99, a stock with an RS rating of 99 has outperformed 99% of all stocks based on 12-month price performance.
How to use the metric
To capitalize on relative strength, an investor’s search should be focused on stocks with RS ratings of at least 80.
But beware: While the goal is to buy stocks that are performing better than the overall market, stocks with the highest RS ratings aren’t always the best to buy. No doubt, some stocks extend rallies for years. But others will be too far into their price run-up and ready to start a longer-term price decline.
Thus, there is a limit to chasing performance. To avoid this pitfall, investors should focus on stocks that have strong relative strength but have seen a moderate price decline and are just coming out of weeks or months of trading within a limited range. This range will vary by stock, but IBD research shows that most good trading patterns can show declines of up to one-third.
Here, a relative strength line on a chart may be helpful for confirming an RS rating’s buy signal. Offered on some stock-charting tools, including IBD’s, the line is a way to visualize relative strength by comparing a stock’s price performance relative to the movement of the S&P 500 or other benchmark.
When the line is sloping upward, it means the stock is outperforming the benchmark. When it is sloping downward, the stock is lagging behind the benchmark. One reason the RS line is helpful is that the line can rise even when a stock price is falling, meaning its value is falling at a slower pace than the benchmark.
A case study
The value of relative strength could be seen in Google parent Alphabet in January 2020, when its RS rating was 89 before it started a 10-month run when the stock rose 64%. Meta Platforms ’ RS rating was 96 before the Facebook parent hit new highs in March 2023 and ran up 65% in four months. Abercrombie & Fitch , one of 2023’s best-performing stocks, had a 94 rating before it soared 342% in nine months starting in June 2023.
Those stocks weren’t flukes. In a study of the biggest stock-market winners from the early 1950s through 2008, the average RS rating of the best performers before they began their major price runs was 87.
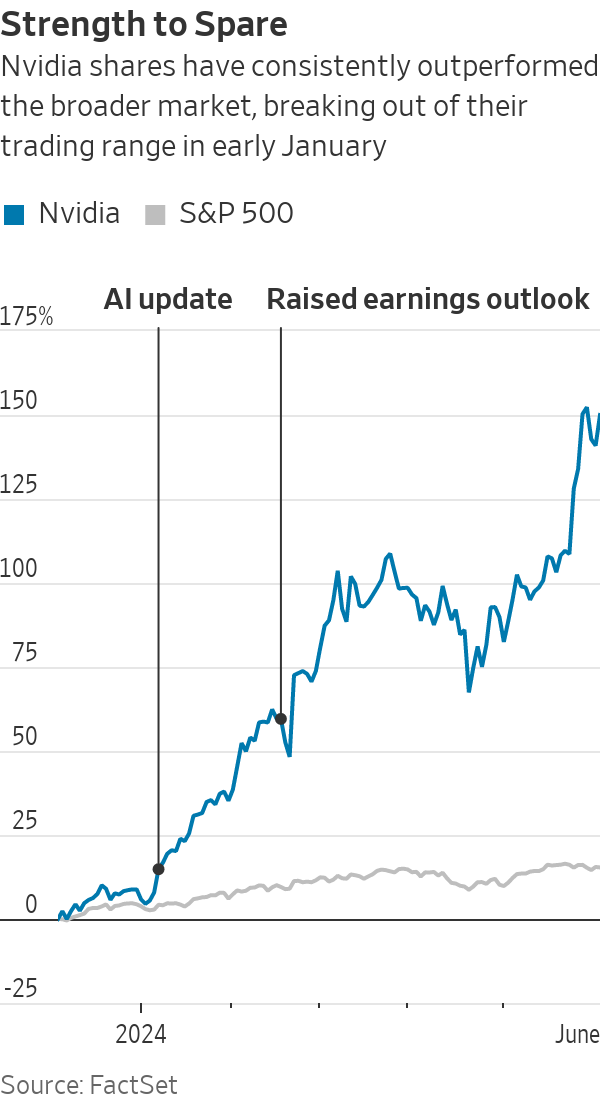
To see relative strength in action, consider Nvidia . The chip stock was an established leader, having shot up 365% from its October 2022 low to its high of $504.48 in late August 2023.
But then it spent the next four months rangebound—giving up some ground, then gaining some back. Through this period, shares held between $392.30 and the August peak, declining no more than 22% from top to bottom.
On Jan. 8, Nvidia broke out of its trading range to new highs. The previous session, Nvidia’s RS rating was 97. And that week, the stock’s relative strength line hit new highs. The catalyst: Investors cheered the company’s update on its latest advancements in artificial intelligence.
Nvidia then rose 16% on Feb. 22 after the company said earnings for the January-ended quarter soared 486% year over year to $5.16 a share. Revenue more than tripled to $22.1 billion. It also significantly raised its earnings and revenue guidance for the quarter that was to end in April. In all, Nvidia climbed 89% from Jan. 5 to its March 7 close.
And the stock has continued to run up, surging past $1,000 a share in late May after the company exceeded that guidance for the April-ended quarter and delivered record revenue of $26 billion and record net profit of $14.88 billion.
Ken Shreve is a senior markets writer at Investor’s Business Daily. Follow him on X @IBD_KShreve for more stock-market analysis and insights, or contact him at ken.shreve@investors.com .
 Copyright 2020, Dow Jones & Company, Inc. All Rights Reserved Worldwide. LEARN MORE


From elevated skincare to handcrafted home pieces, this year’s most thoughtful gifts go beyond the expected.

A haven for hedge-fund titans and Hollywood grandees, Greenwich is one of the world’s most expensive residential enclaves, where eye-watering prices meet unapologetic grandeur.


The lunar flyby would be the deepest humans have traveled in space in decades.
4 min
It’s go time for the highest-stakes mission at NASA in more than 50 years.
On April 1, the agency is set to launch four astronauts around the moon, the deepest human spaceflight since the final Apollo lunar landing in 1972.
The launch window for Artemis II , as the mission is called, opens at 6:24 p.m. ET.
National Aeronautics and Space Administration teams have been preparing the vehicles to depart from Florida’s Kennedy Space Center on the planned roughly 10-day trip. Crew members have trained for years for this moment.
Reid Wiseman, the NASA astronaut serving as mission commander, said he doesn’t fear taking the voyage. A widower, he does worry at times about what he is putting his daughters through.
“I could have a very comfortable life for them,” Wiseman said in an interview last September.
“But I’m also a human, and I see the spirit in their eyes that is burning in my soul too. And so we’ve just got to never stop going.”
Wiseman’s crewmates on Artemis II are NASA’s Victor Glover and Christina Koch, as well as Canadian Space Agency astronaut Jeremy Hansen.

What are the goals for Artemis II?
The biggest one: Safely fly the crew on vehicles that have never carried astronauts before.
The towering Space Launch System rocket has the job of lofting a vehicle called Orion into space and on its way to the moon.
Orion is designed to carry the crew around the moon and back. Myriad systems on the ship—life support, communications, navigation—will be tested with the astronauts on board.
SLS and Orion don’t have much flight experience. The vehicles last flew in 2022, when the agency completed its uncrewed Artemis I mission .
How is the mission expected to unfold?
Artemis II will begin when SLS takes off from a launchpad in Florida with Orion stacked on top of it.
The so-called upper stage of SLS will later separate from the main part of the rocket with Orion attached, and use its engine to set up the latter vehicle for a push to the moon.
After Orion separates from the upper stage, it will conduct what is called a translunar injection—the engine firing that commits Orion to soaring out to the moon. It will fly to the moon over the course of a few days and travel around its far side.
Orion will face a tough return home after speeding through space. As it hits Earth’s atmosphere, Orion will be flying at 25,000 miles an hour and face temperatures of 5,000 degrees as it slows down. The capsule is designed to land under parachutes in the Pacific Ocean, not far from San Diego.

Is it possible Artemis II will be delayed?
Yes.
For safety reasons, the agency won’t launch if certain tough weather conditions roll through the Cape Canaveral, Fla., area. Delays caused by technical problems are possible, too. NASA has other dates identified for the mission if it doesn’t begin April 1.
Who are the astronauts flying on Artemis II?
The crew will be led by Wiseman, a retired Navy pilot who completed military deployments before joining NASA’s astronaut corps. He traveled to the International Space Station in 2014.
Two other astronauts will represent NASA during the mission: Glover, an experienced Navy pilot, and Koch, who began her career as an electrical engineer for the agency and once spent a year at a research station in the South Pole. Both have traveled to the space station before.
Hansen is a military pilot who joined Canada’s astronaut corps in 2009. He will be making his first trip to space.
Koch’s participation in Artemis II will mark the first time a woman has flown beyond orbits near Earth. Glover and Hansen will be the first African-American and non-American astronauts, respectively, to do the same.
What will the astronauts do during the flight?
The astronauts will evaluate how Orion flies, practice emergency procedures and capture images of the far side of the moon for scientific and exploration purposes (they may become the first humans to see parts of the far side of the lunar surface). Health-tracking projects of the astronauts are designed to inform future missions.
Those efforts will play out in Orion’s crew module, which has about two minivans worth of living area.
On board, the astronauts will spend about 30 minutes a day exercising, using a device that allows them to do dead lifts, rowing and more. Sleep will come in eight-hour stretches in hammocks.
There is a custom-made warmer for meals, with beef brisket and veggie quiche on the menu.
Each astronaut is permitted two flavored beverages a day, including coffee. The crew will hold one hourlong shared meal each day.
The Universal Waste Management System—that’s the toilet—uses air flow to pull fluid and solid waste away into containers.
What happens after Artemis II?
Assuming it goes well, NASA will march on to Artemis III, scheduled for next year. During that operation, NASA plans to launch Orion with crew members on board and have the ship practice docking with lunar-lander vehicles that Elon Musk’s SpaceX and Jeff Bezos’ Blue Origin have been developing. The rendezvous operations will occur relatively close to Earth.
NASA hopes that its contractors and the agency itself are ready to attempt one or more lunar landing missions in 2028. Many current and former spaceflight officials are skeptical that timeline is feasible.

A survey of people with at least $1 million in investable assets found women in their 30s and 40s look nothing like older generations in terms of assets and priorities

Formula 1 may be the world’s most glamorous sport, but for Oscar Piastri, it’s also one of the most lucrative. At just 24, Australia’s highest-paid athlete is earning more than US$40 million a year.