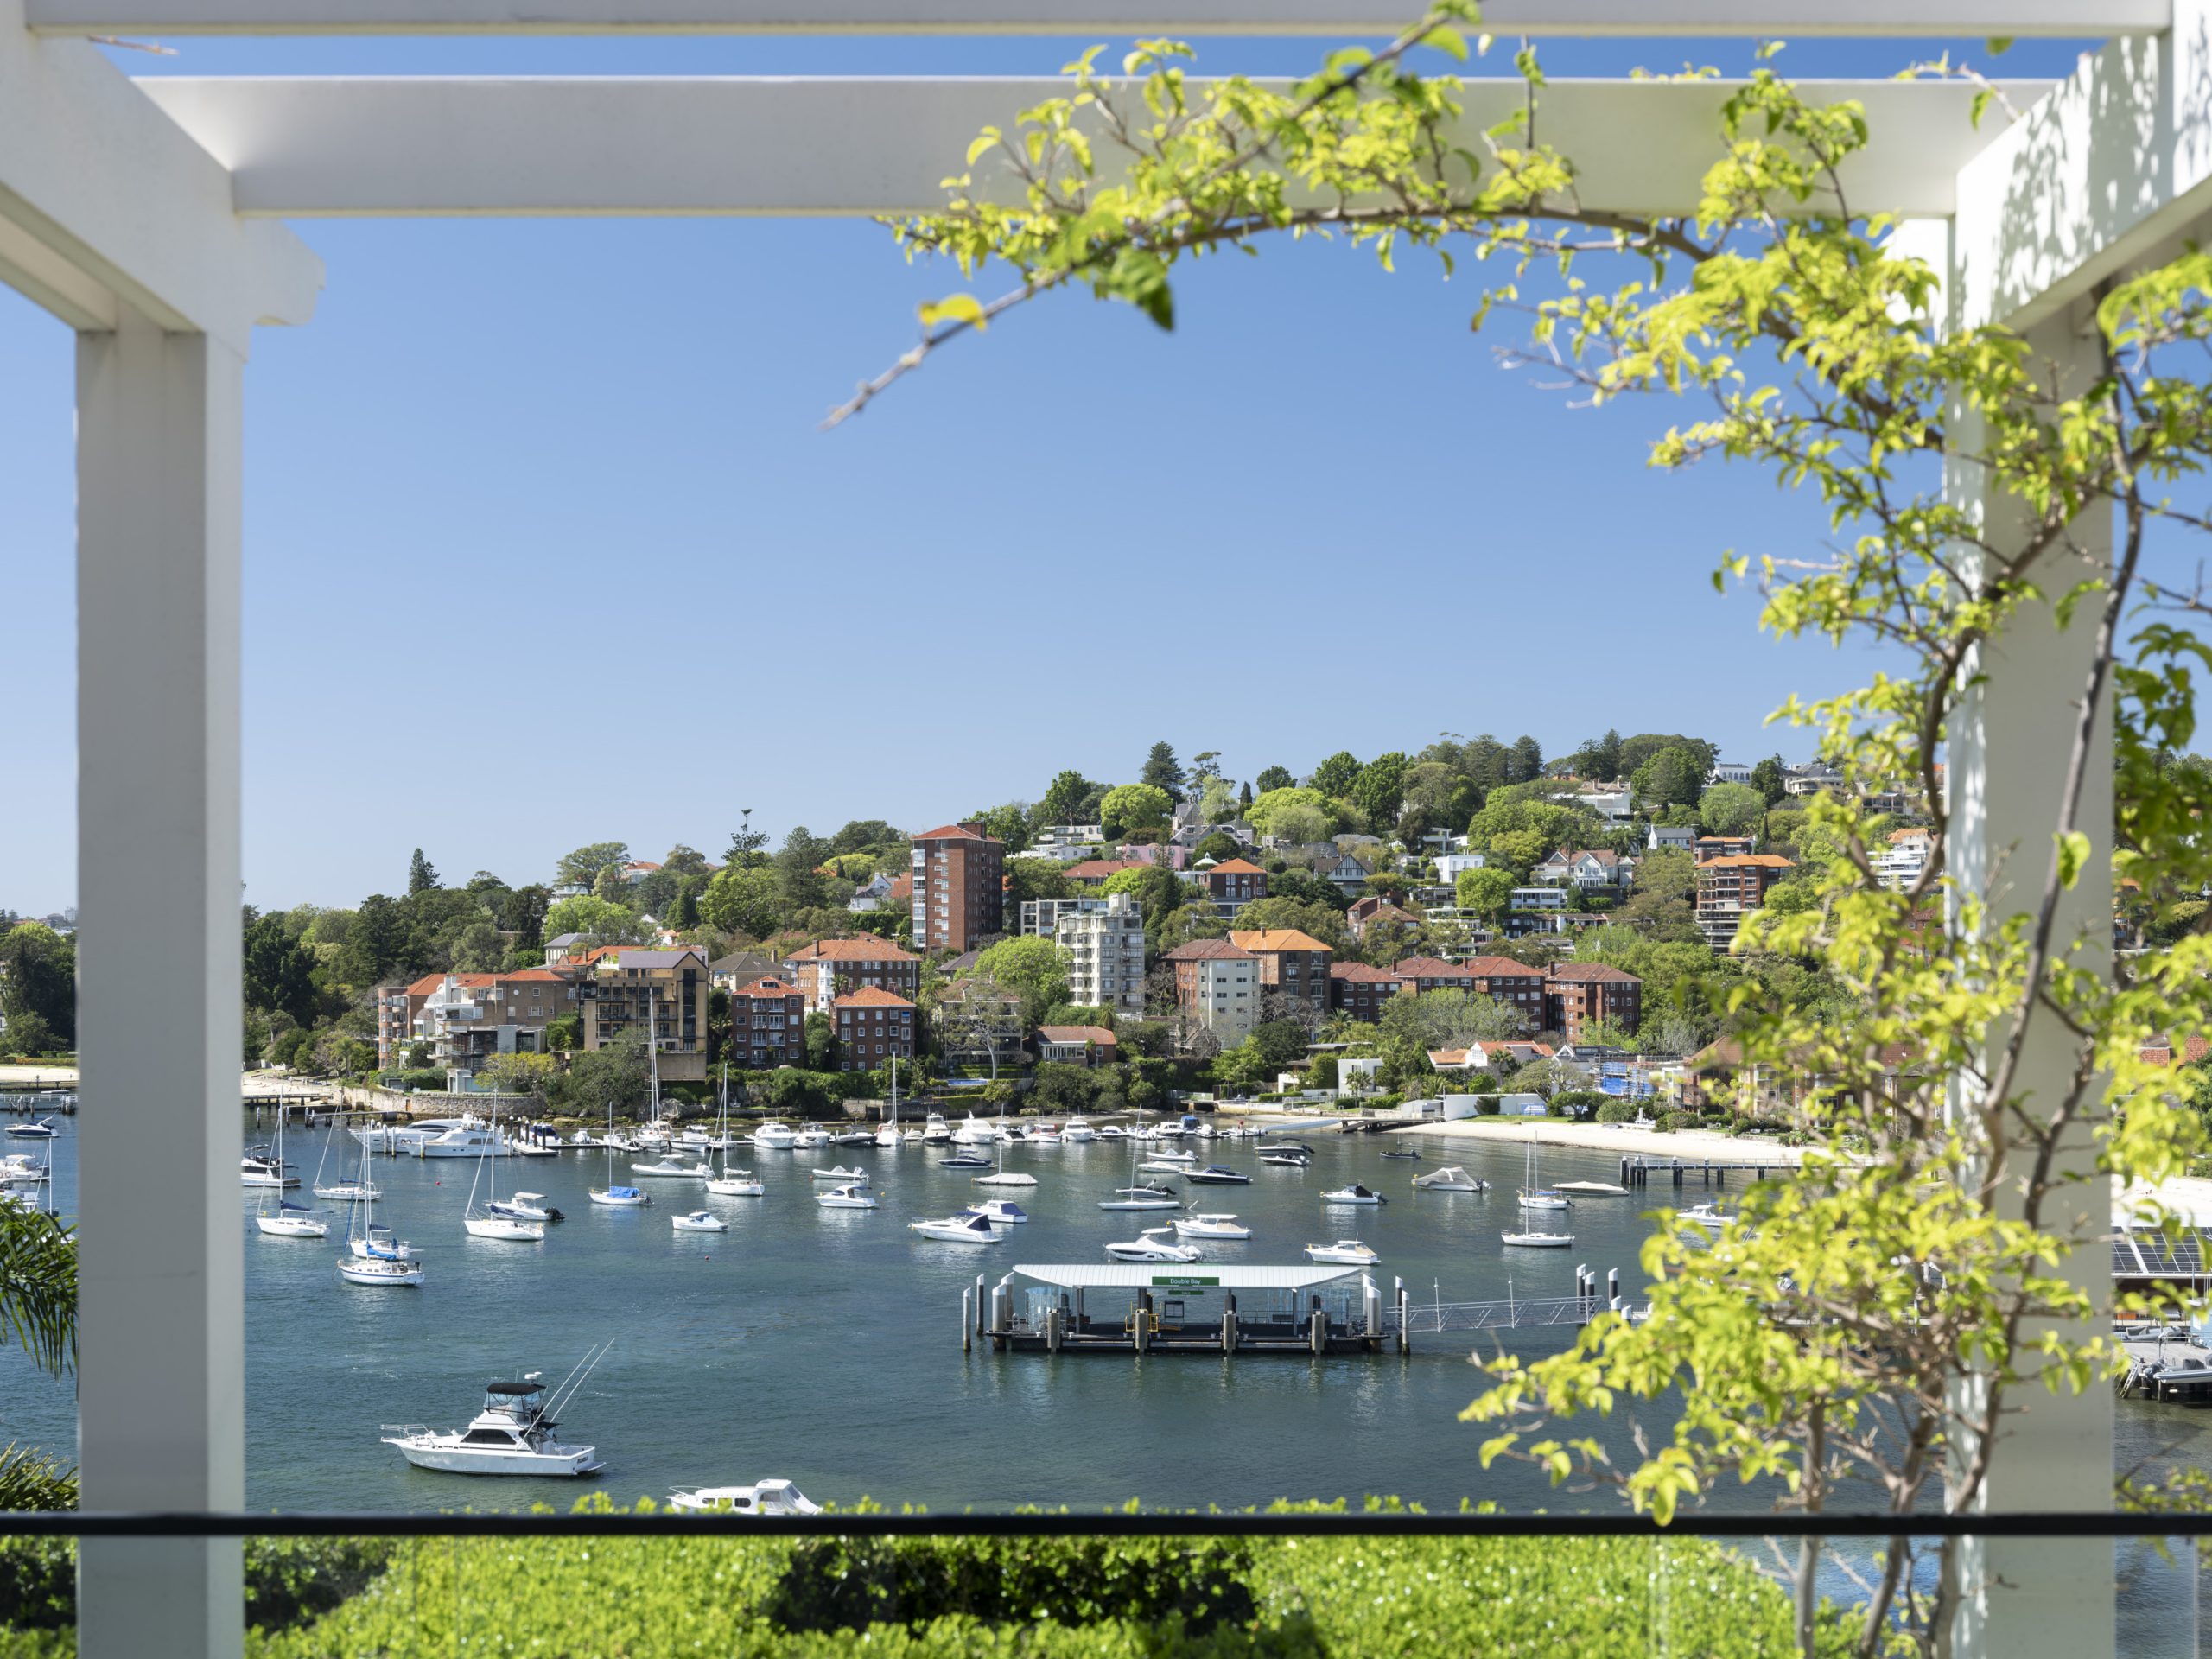
REVEALED: WHAT DEFINES LUXURY & QUALITY OF LIFE AROUND THE WORLD
A luxury lifestyle might cost more than it used to, but how does it compare with cities around the world?
 4 min
4 min
A life of luxury in Australia costs more than it used to in Australia. Inflationary pressures have pushed everything from the price of real estate, extravagant dining experiences and lavish weekends away up higher than they’ve ever been before.
The price tag for luxury homes across Australia now starts at $2.52 million, up an eye watering 72 per cent from a decade ago.
But what counts as luxury varies significantly depending on location. Sydney remains Australia’s most expensive market, where luxury begins at $4 million. The Gold Coast has now taken second place at $2.6 million, pushing ahead of Melbourne’s $2.49 million entry point.
That’s according to Luxury Report, produced by real estate firm Ray White, analysed what defines luxury today.
Global comparison
Housing affordability continues to hover at crisis levels in Australia, but how does a luxury lifestyle in Australia compare with the rest of the world?
A look at real estate markets abroad quickly reveals that where you choose to live can have a huge impact on what it costs to put a roof over your head.
For example, in Monaco, a small apartment can set you back more than $38,800 per square metre. Here, more than 40 per cent of the nation’s residents are millionaires: the highest proportion of any city in the world.
According to the ninth edition of a report that offers a snapshot of how global cities compare on cost of living, quality of life and income and affordability, Sydney and Melbourne isn’t anywhere near as expensive as other cities around the world.
Which puts it perspective for the wealthy trying to grapple with whether or not they can afford to keep the holiday house, or whether to list it for sale.
The Mapping the World’s Prices 2025 report ranked the cheapest and most expensive cities around the world, with the Deutsche Bank Research Institute assessing global cost and quality of life indicators.
The report tracks what it costs to enjoy a luxurious lifestyle. This includes the prices of everything from groceries, wine, buying a city apartment, salaries and general measures of the quality of life. Other factors measured include the cost of a summer dress, a carton of cigarettes, internet data and what it costs to dine out in some of the best restaurants.
Produced by the Deutsche Bank Research Institute, the report points out that inflation making a roaring comeback over the last five years, currency swings are influencing purchasing power and the world’s cost of living leaderboard is therefore shifting quickly.
Researchers focused on the 69 cities that matter most to global financial markets, and therefore your investment portfolio.
Here’s a breakdown of the most expensive places to live around the world:
Quality of life
If you’re seeking a good quality life, the top five cities for a quality lifestyle listed in the report are Luxembourg, Copenhagen, Amsterdam, Vienna and Helsinki.
Meanwhile, Zurich and Geneva have slipped out of the top five because cost of living pressures have continued to skyrocket, making these cities now the most expensive in the world to live in.
Buying an apartment
Prices for an apartment have fallen by 20 per cent in Hong Kong over the last five years, but still top the list, followed by Zurich, Singapore, Seoul and Geneve.
London and New York are just outside the top five, while Beijing comes in at ninth place, highlighting the elevated property prices in China. If you’re looking to buy an apartment, unit or townhouse in Australia, the median price in July 2025 was $686,399.
Utility bills
Electricity bills cost around $350 to $420 per quarter in most states of Australia, which is much cheaper than what Germans are forking out. Munich, Frankfurt and Berlin have the highest energy bills in the world, while Warsaw, Vienna and Prague also make the top 10, highlighting that Eastern European cities are counting the costs of the lack of cheap Russian gas.
iPhone
If you want to pick up a smartphone to keep in touch with loved ones while travelling, you’re going to pay a lot more for one in Turkey, Brazil, Egypt, India and Sweden. Seoul is the cheapest as competition with Samsung makes it even cheaper than in US cities.
Groceries
Geneva, San Francisco, Zurich, New York and Boston are the top five costly places to stock up on groceries. Even by Swiss standards, groceries in Geneva are generally expensive, while groceries in Sydney are 39.41 per cent lower than in Geneva.
Wine
Picking up a bottle of wine will set you back if you’re in Singapore, where you’ll pay more than anywhere else in the 69 countries surveyed. Jakarta, Seoul, New York and Oslo are also expensive. It’s much cheaper to purchase wine in some other lovely cities, including Rome, Johannesburg, Cape Town, Budapest and Lisbon.
Cigarettes
Incredible, Australia tops the list anywhere in the world for the price of cigarettes. Government taxes and duties applied to cigarettes aim to dissuade consumption mean that Melbourne and Sydney have been ranked as the most expensive place for cigarettes, along with New Zealand.
Restaurants
Eating out in a swanky restaurant in Australia can set you back up to $300 per person. That might sound expensive if you’re trying to feed a family of four, it’s going to be more in Zurich, Geneva, New York, San Francisco and Boston.
Buying a car
Singapore and Copenhagen actively discourage the purchase of cars and are the most expensive cities to purchase a set of wheels. In fact, the cheapest possible car will set you back around $150,000 in Singapore Dollars. That’s for a basic car like a Honda Jazz, which is the same price as a Porche in any other part of the world.
The reason cars are so expensive in Singapore is the huge population in a limited space meaning the government prioritises a clean environment and less traffic. The next most expensive places to purchase a car are Tel Aviv, Istanbul and Abu Dhabi.
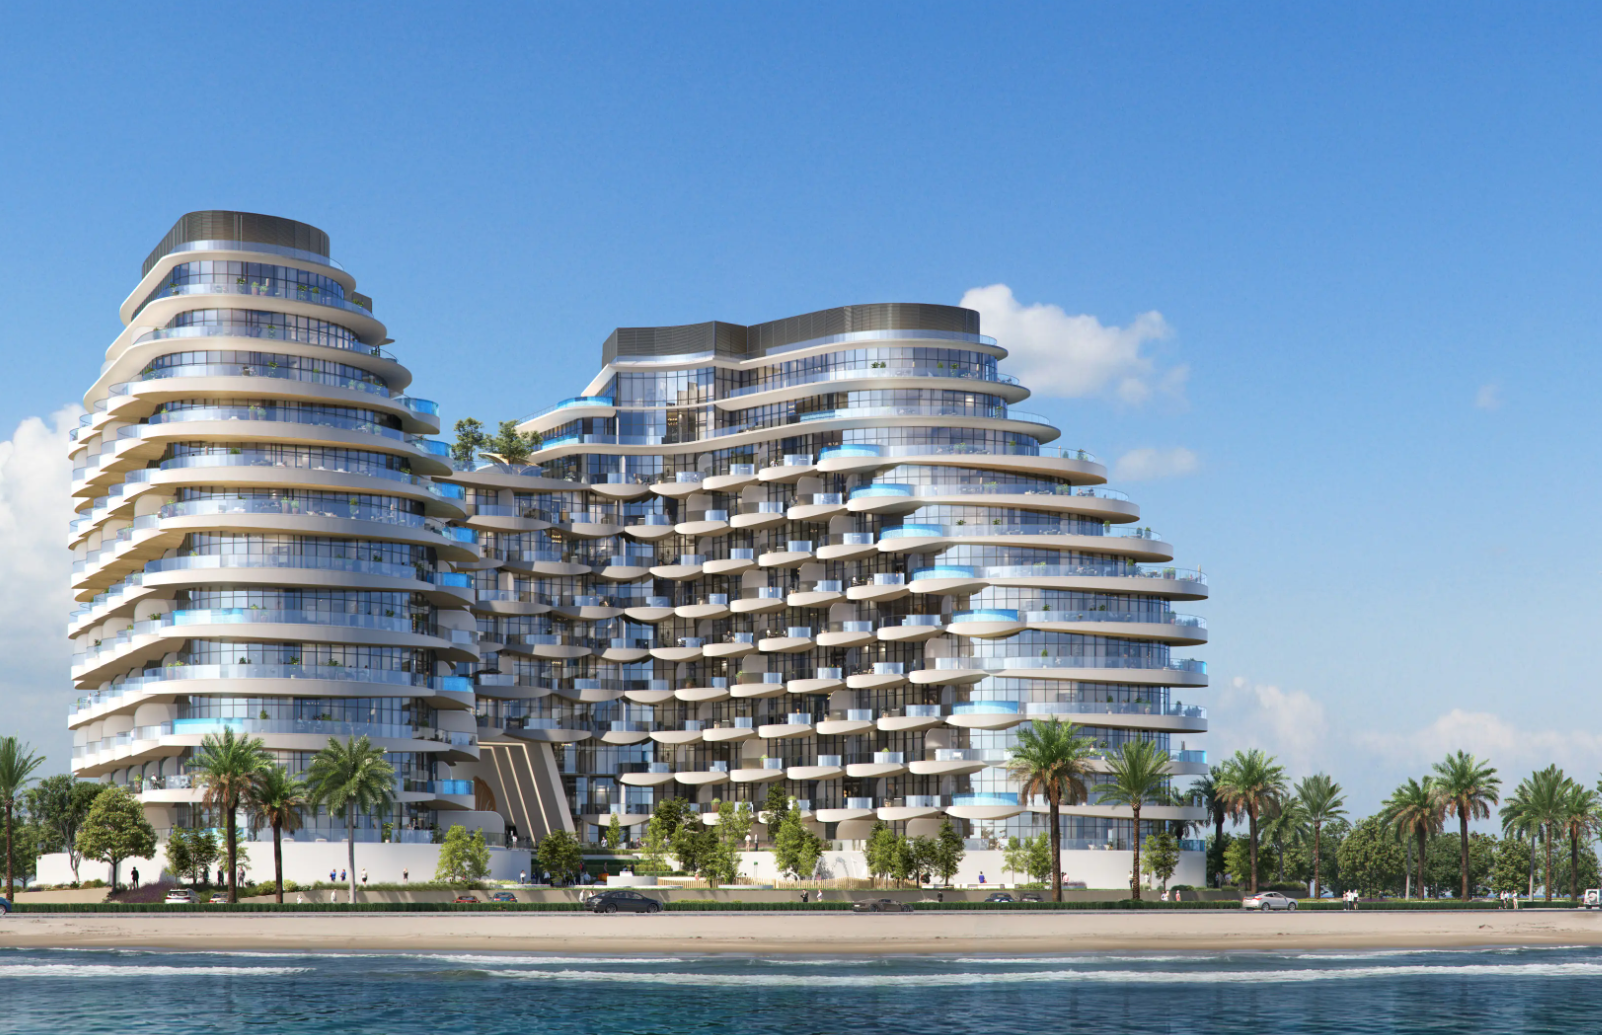
BNW Developments has established a Sydney presence, joining Arada and Sobha Realty among the growing number of UAE developers pursuing Australian buyers and development opportunities.
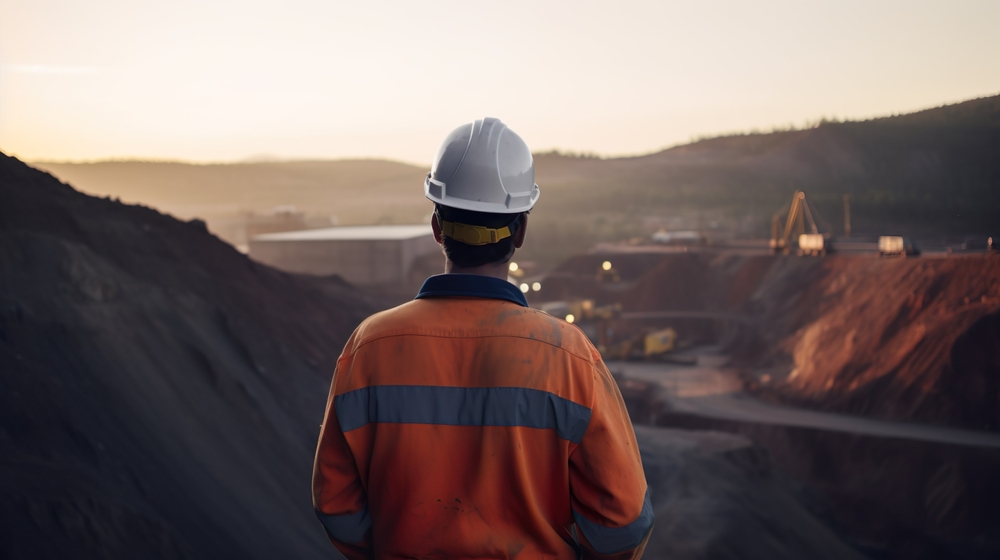
Australian shares fell on Thursday as Wall Street weakness, rising oil and persistent rate concerns weighed on most of the market. The S&P/ASX 200 declined 0.72 per cent to 8,702. The All Ordinaries lost 0.66 per cent to finish at 8,897. Mining stocks were hit particularly hard, while real estate also dragged on the index. …
Continue reading “ASX falls 0.7 per cent as miners and property stocks retreat”

 2 min
2 minAustralian shares fell on Thursday as Wall Street weakness, rising oil and persistent rate concerns weighed on most of the market.
The S&P/ASX 200 declined 0.72 per cent to 8,702. The All Ordinaries lost 0.66 per cent to finish at 8,897. Mining stocks were hit particularly hard, while real estate also dragged on the index.
Energy was the notable exception, gaining more than one per cent as Brent crude traded above US$103 a barrel. Oil had moved higher amid uncertainty surrounding potential US diesel-export restrictions and broader geopolitical supply risks. The move supported energy producers but renewed concern about inflation inputs across transport and the wider economy.
Gold shares were weak even as spot bullion remained historically elevated. The All Ordinaries Gold index fell about 2.25 per cent, showing that equity performance can diverge from the commodity because of valuation, currency, operating and company-specific factors.
Zip was a prominent loser, falling 11.38 per cent after the company reported short sales after the previous close. Nine Entertainment also weakened after UBS analysts warned of near-term revenue challenges associated with its advertising-supported subscription tier.
Premier Investments led larger winners despite caution about the retail environment. Breville, in which Premier owns a significant stake, also appeared among leading movers. In the broader ASX 300 screen, Myer gained 11.43 per cent and MAAS Group rose 7.93 per cent, while Lotus Resources fell 10.53 per cent. These percentage moves should be checked against company announcements and trading liquidity before attributing causes.
The Australian dollar was broadly flat at US70.38 cents. Spot gold was around US$4,280 an ounce, Brent crude approximately US$103.08 a barrel and iron ore near US$96.90 a tonne late in the session.
The rate outlook remains the central domestic catalyst. Labour-market weakness has not eliminated the possibility of an RBA increase next week, leaving banks, listed property and other rate-sensitive sectors exposed to changing expectations.
Market dashboard
S&P/ASX 200: 8,702, down 0.72 per cent.
All Ordinaries: 8,897, down 0.66 per cent.
Best sector: Energy, up more than one per cent.
Weakest areas: Real estate and materials were the major drags; confirm final sector percentages before publication.
Material winner: Premier Investments led the large-company gainers. Confirm its final closing move from the ASX before publication.
Material loser: Zip, down 11.38 per cent.
ASX 300 percentage leader: Myer, up 11.43 per cent.
ASX 300 percentage laggard: Zip, down 11.38 per cent.
AUD/USD: Approximately US$0.7038, broadly flat.

The sports-car maker delivered 279,449 cars last year, down from 310,718 in 2024.

Once a sleepy surf town, Noosa has become Australia’s prestige property hotspot, where multi-million dollar knockdowns, architectural showpieces and record-setting sales are the new normal.