The winners and losers in Australian residential real estate in 2025
Australia’s housing market rebounded sharply in 2025, with lower-value suburbs and resource regions driving growth as rate cuts, tight supply and renewed competition reshaped the year.
 5 min
5 min
Australia’s housing market staged a turnaround in 2025, defying intense affordability and cost-of-living pressures to deliver an above-decade-average growth rate of 7.7% through the year-to-date.
Cotality’s annual Best of the Best report, a detailed nationwide breakdown of the suburbs that rose fastest, had the highest rent return or offered the most accessible entry points, identifies which markets led the year’s recovery.
National dwelling values are set to close 2025 at least eight per cent higher, a result Cotality Australia Head of Research Eliza Owen says highlights how quickly conditions shifted after a challenging start.
“Markets entered 2025 under considerable pressure. Affordability had hit a series high, serviceability was stretched and price growth had flattened out. What followed was an unexpectedly strong rebound as interest rate cuts, easing inflation and limited supply reignited competition,” Ms Owen said.
Three rate cuts, an expansion of the 5% Home Guarantee Deposit Scheme and persistently low listing volumes helped drive the recovery, with the housing market recording three consecutive months of growth of at least 1% by November and reaching a new high of $12 trillion.
Owen said the turnaround was most visible across lower-value markets and regions where buyers were able to respond quickly to more favourable credit conditions.
“Tight supply meant even modest demand created upward pressure on prices. Cheaper markets were had the most acceleration because they remained within reach for buyers navigating higher living costs,” she said.

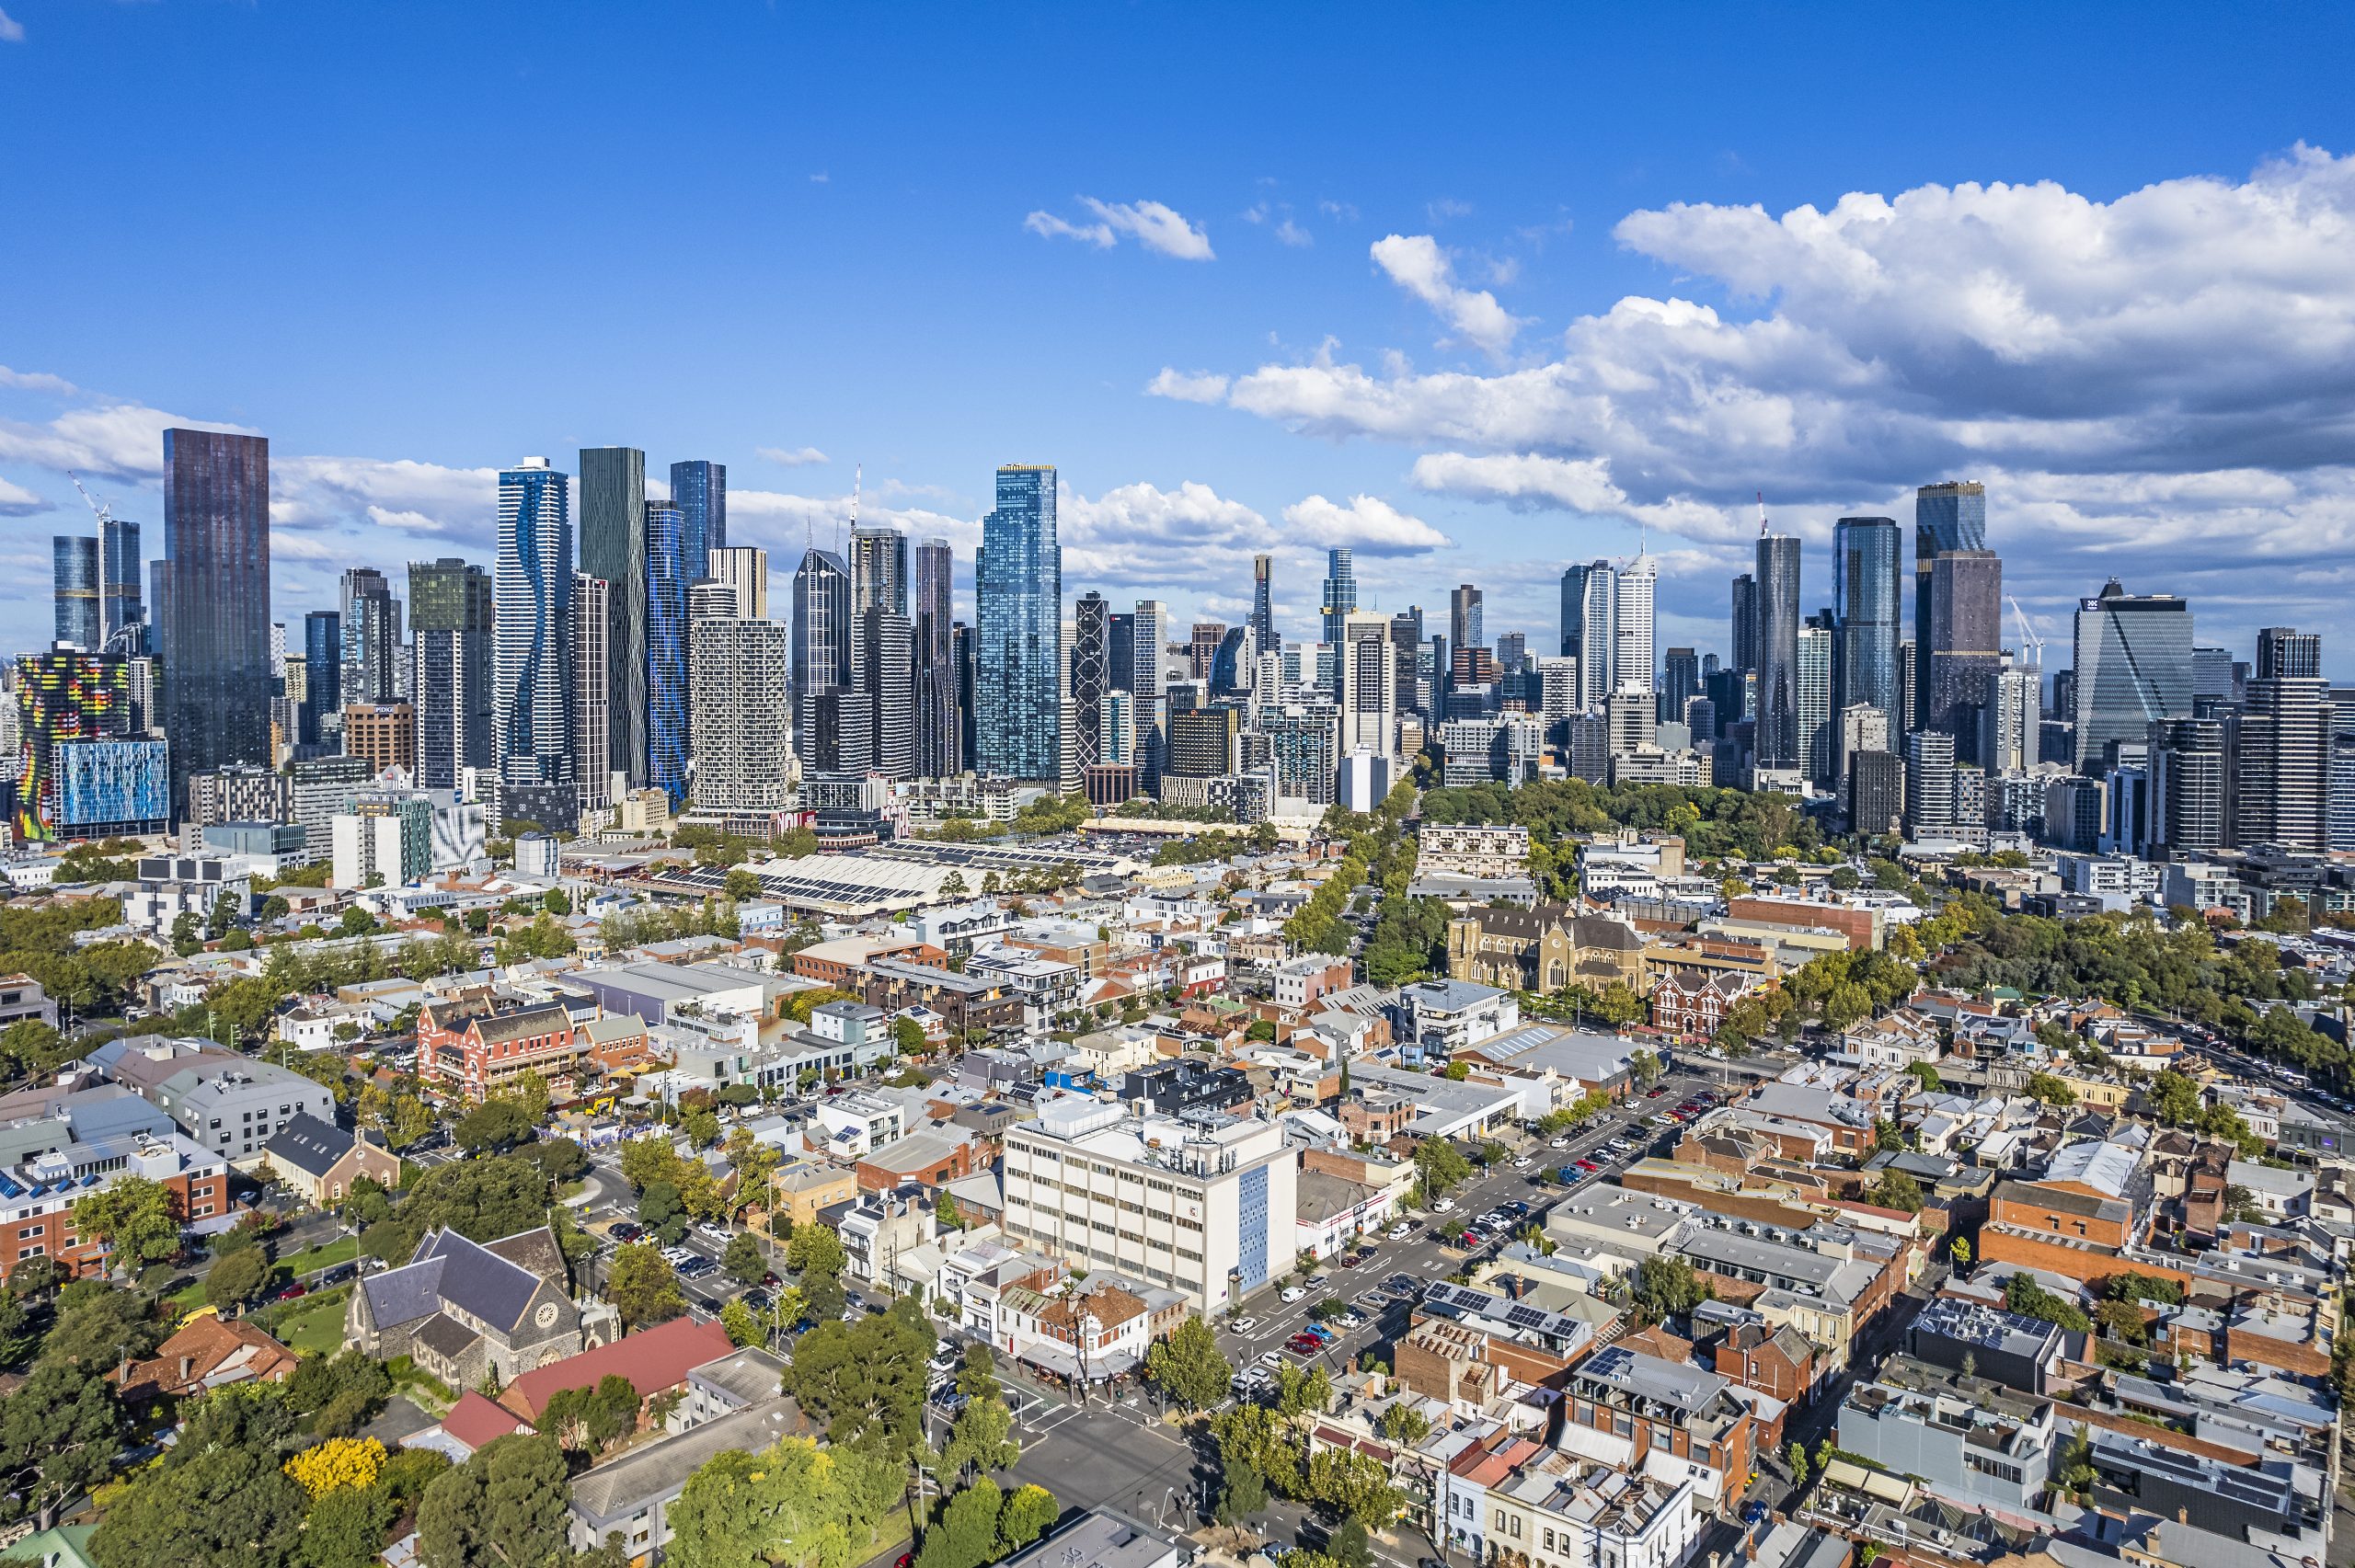
Prestige Sydney remains Australia’s price leader
Sydney’s top-end suburbs sat in their own price bracket in 2025, widening the gap between premium enclaves and the rest of the country.
Point Piper led the national list with a median house value of $17.3 million and unit medians above $3.1 million, followed by long-established areas such as Bellevue Hill, Vaucluse,
Tamarama and Rose Bay.
Owen said the resilience of premium Sydney markets was in sharp contrast to affordability pressures elsewhere.
“Affordability constraints were a defining feature of 2025, yet premium markets continued to operate on their own cycle. These suburbs are far less sensitive to borrowing costs and
listing trends, which is why their performance often diverges from the broader market,” she said.
Mosman recorded the highest total value of house sales nationally at $1.58 billion across 229 transactions, underlining the scale of turnover even in a year of strained serviceability.
Lower-value suburbs delivered the strongest gains
Western Australia dominated high house value growth in 2025, with Kalbarri increasing 40.2% to $515,378 followed by Rangeway (32.2%) and Lockyer (32.0%).
Similar trends emerged in the unit market, with strong results concentrated in Queensland’s mid-priced regions such as Cranbrook (up 29.3%) and Wilsonton (up 26.9%).
Ms Owen said the performance of these markets highlighted the role of affordability at a time of constrained borrowing power.
“Lower value areas offered buyers an opportunity to get into the market if they had the capacity to service a mortgage. Once interest rate cuts started to flow through, demand lifted
quickly in those areas where prices had further room to grow,” she said.
“Investors were a particularly strong driver of demand in markets across WA and QLD, where the share of new mortgage lending to investors reached 38.3% and 41.1%
respectively.”

Perth, Brisbane and Darwin lead capital-city upswing
Darwin posted the strongest rise among the capitals at 17.1% through the year-to-date, following a flat result in 2024, joined by Brisbane and Perth as Australia’s three top-performing capital cities.
The fastest growing capital-city suburb for houses was Mandogalup in Perth (up 33.0% to $944,609), alongside several outer Darwin suburbs where more moderate entry points below $600,000 supported stronger value growth.
The most affordable capital-city suburbs for houses were clustered around Greater Hobart, including Gagebrook, Herdsmans Cove and Bridgewater, all with medians under $450,000.
Suburbs in Adelaide and Darwin provided some of the best value for unit buyers, with medians ranging from less than $250,000 in Hackham, Adelaide to $328,416 for Karama in Darwin.
Biggest gains and the steepest falls in regional Australia
Strong upswings in WA and Queensland contrasted with declines in other regional pockets.
House values fell 11.6% in Millthorpe (NSW) and 10.5% in Tennant Creek (NT) while several unit markets recorded annual declines, including South Hedland (down 14.1%) and Mulwala (down 11.8%).
Owen said these differences reflected the uneven backdrop of supply levels, migration flows and localised demand.
“Some regional areas are still benefiting from relative affordability and tight rental conditions.
Others are adjusting to earlier periods of rapid growth or shifts in local economic activity,” she said.

Mining towns produced the highest yields
Rental demand remained firm across key resource corridors in regional WA and parts of regional Queensland, where constrained supply, strong employment bases and short-stay
workforces contributed to some of the highest yields in the country.
Newman, in the Pilbara, delivered the strongest house yields at 12.6%, reflecting demand linked to iron ore operations, Kambalda East, near the Goldfields mining belt, followed at
12.2%, supported by nickel and gold activity.
Unit yields were even stronger, with South Hedland leading the country at 17.8%, while Newman recorded 14.3% and Pegs Creek recorded 13.2%, as apartment stock is limited
and worker demand remains consistent.
Pegs Creek, located in Karratha, recorded a 23.5% increase in house rents over the year and Rockhampton City recorded a 21.1% jump in unit rents.
Constraints to shape 2026
Market conditions are expected to be more restrained in 2026 as borrowing capacity, affordability and credit assessments place limitations on demand.
National listings remain 18% below the five-year average and new housing completions continue to trail household formation, maintaining the structural imbalance that supported
stronger conditions in 2025.
Owen said that imbalance alone is not enough to drive the same level of growth next year.
“Supply remains tight, but the demand environment is shifting. Inflation forecasts have been revised higher, interest rate expectations have adjusted with them, and households are
facing stricter borrowing assessments. Those factors can temper buyer activity even when stock levels are low,” she said.
“Lower value markets may still outperform because they carry less sensitivity to credit constraints, but overall growth is likely to be more measured compared with 2025.”
Key findings – Cotality Best of The Best (BoB) 2025
- Lower-value suburbs delivered the strongest value gains, led by Kalbarri (WA), up 40.2% for houses, and Cranbrook (Qld), up 29.3% for units.
- Sydney’s premium suburbs remained the country’s highest value markets, with Point Piper recording a house median of $17.3 million and unit median of more than $3.1
million.
- Mosman recorded the highest total value of house sales nationally, with $1.58 billion transacted across 229 sales.
- WA’s resource-linked towns produced the nation’s strongest rental yields, with Newman at 12.6% for houses and South Hedland at 17.8% for units.
- Pegs Creek (WA) had the highest annual house rent increase at 23.5%, unit rents rose the highest in Rockhampton (QLD), up 21.1%.
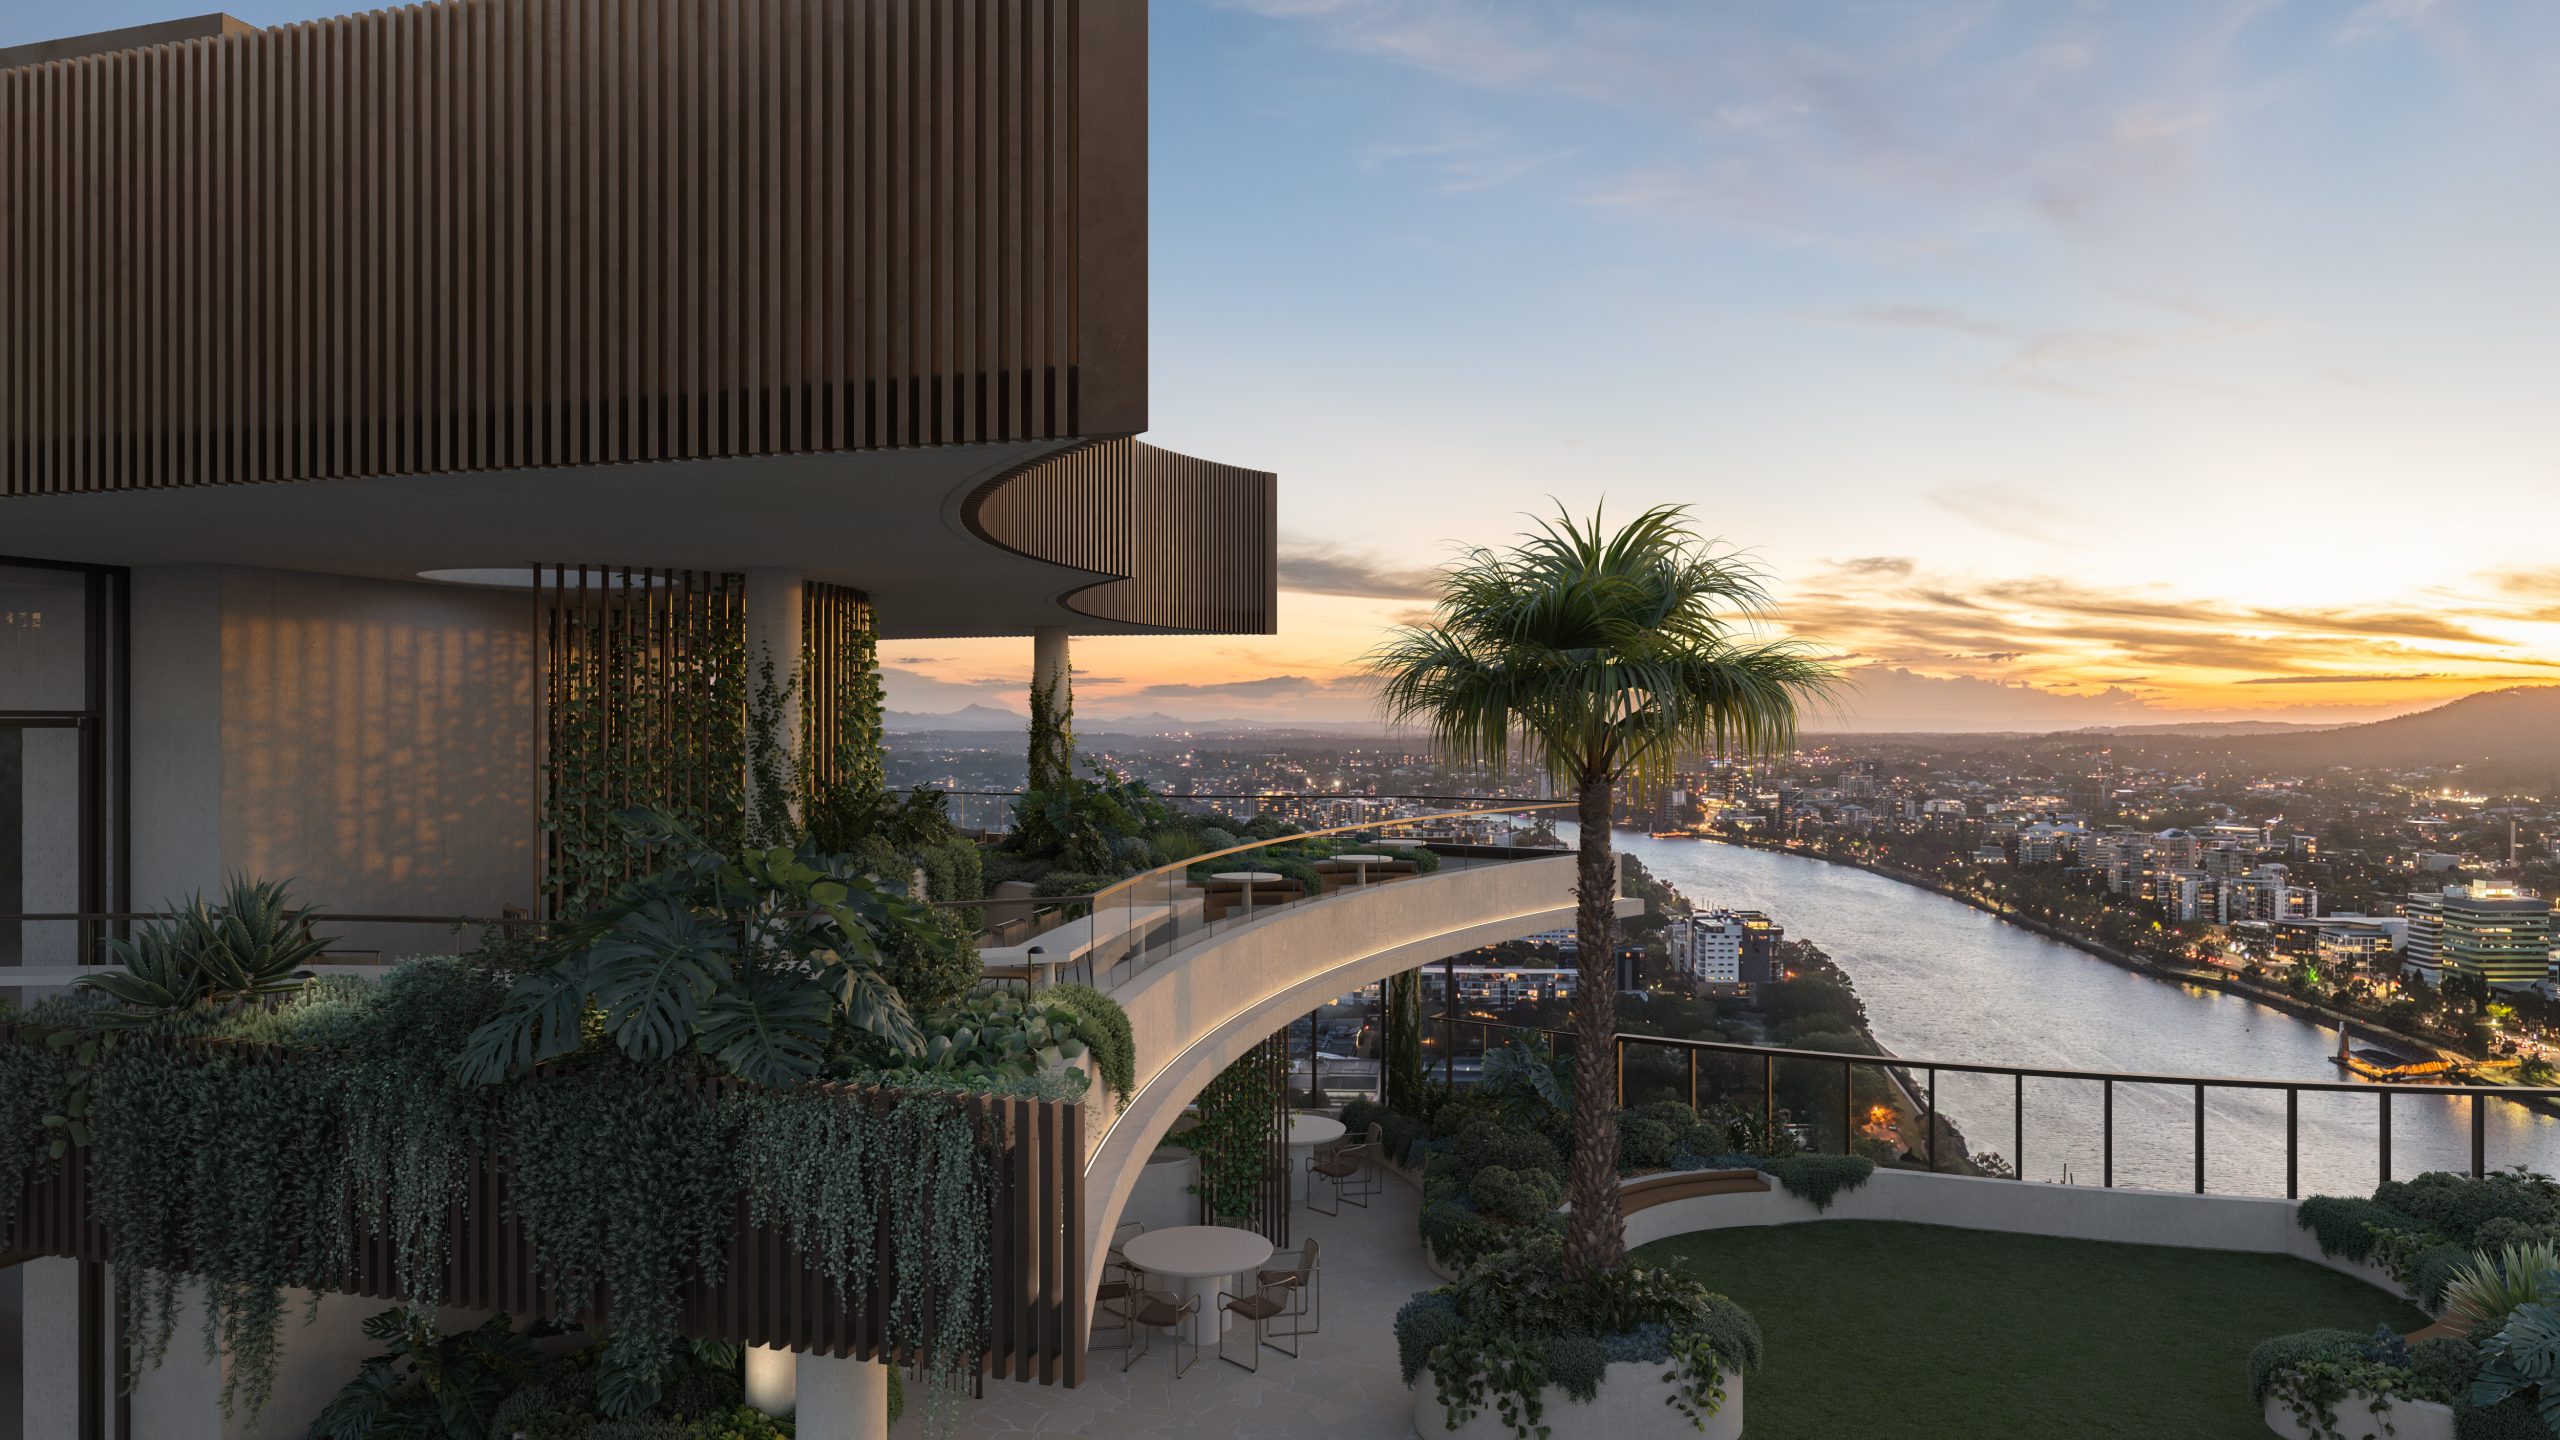
Set on one of the city’s last absolute riverfront sites, The Riversdale by Mosaic combines irreplaceable waterfront ownership with one of Brisbane’s most significant residential opportunities.
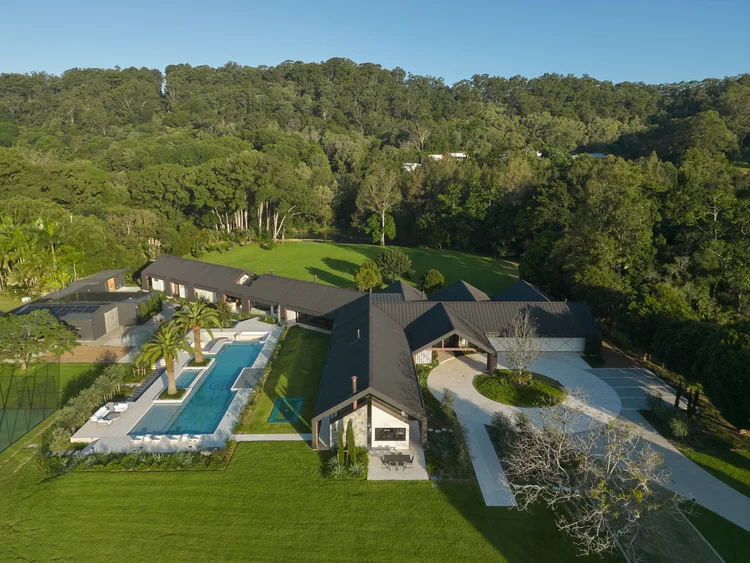
Margot Robbie may have travelled from a Queensland farm to the highest reaches of Hollywood, but a reported $28 million property deal suggests the Gold Coast has never lost its hold on her. The Australian actor and producer is believed to be the mystery buyer of Redwood, a seven-acre Currumbin Valley estate transformed into the …
Continue reading “Margot Robbie Reportedly Behind $28 Million Currumbin Valley Homecoming”
 3 min
3 min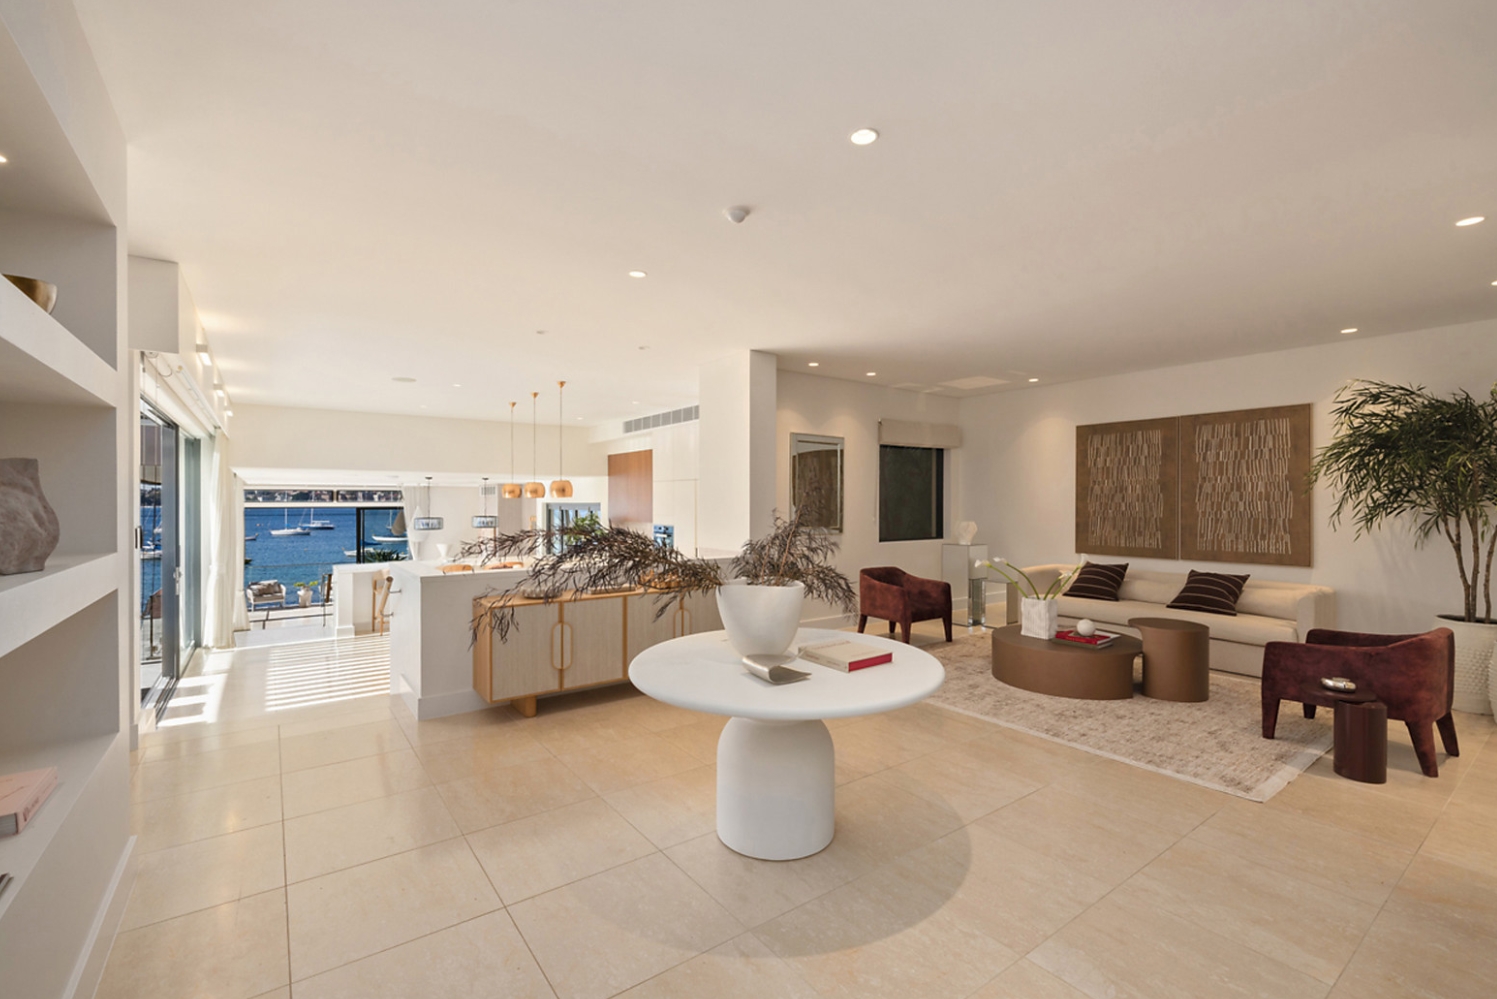
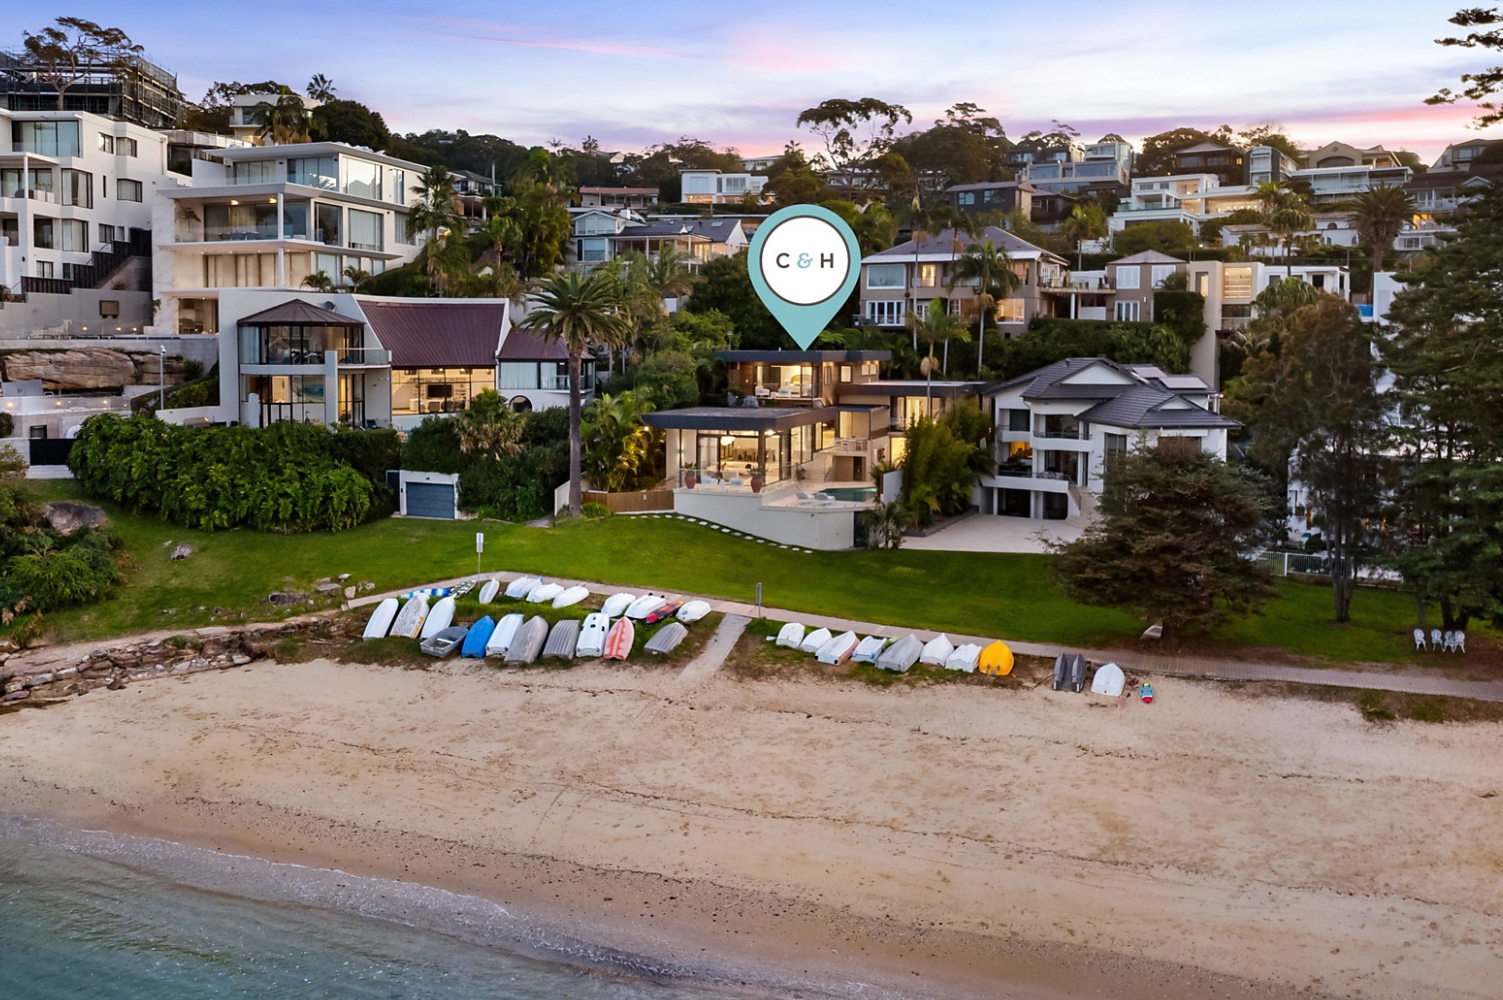
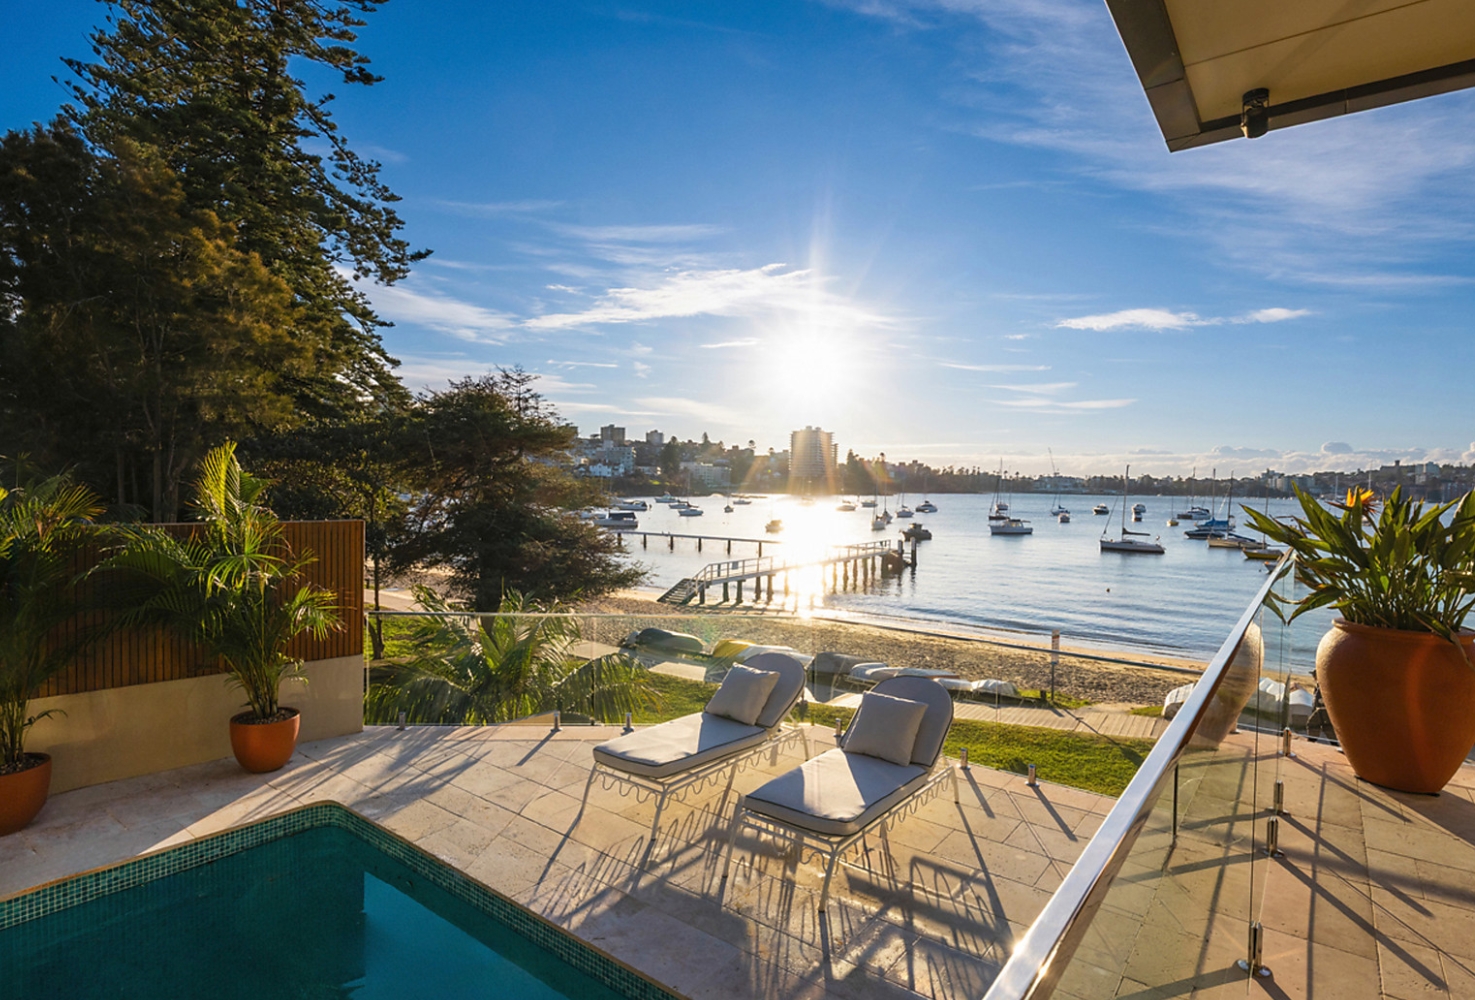
A landmark beachfront home in Balgowlah Heights has sold for $17.5 million, setting a new residential record for the tightly held Northern Beaches suburb.
The six-bedroom residence at 30A Beatty Street changed hands on July 21 through Clarke & Humel Property, eclipsing its own previous benchmark by $5.7 million.
The property last sold for $11.8 million in October 2017, a result reported as a Balgowlah Heights record at the time. Its latest sale represents an increase of more than 48% in almost nine years and places it well ahead of other known sales in the suburb.
It is not the first time the address has reshaped local expectations. The home sold for $3.15 million in 2013 before extensive alterations and additions transformed it into the substantial trophy residence seen today. From that transaction to its latest sale, its recorded value has increased more than fivefold.
Occupying 1,074sqm in an exclusive no-through pocket, the property backs directly onto the golden sand of Forty Baskets Beach. A gate at the bottom of the garden opens to the beach and surrounding foreshore walks, creating the kind of direct harbour access rarely available on the Northern Beaches.
The home’s elevated, cascading design takes full advantage of its position. Walls of glass frame panoramic views across North Harbour, while a succession of indoor and outdoor living spaces follows the slope towards the water.
Arrival is suitably dramatic. The four-car garage—complete with harbour views—is connected to the residence by a lift. From there, a covered walkway leads through tropical gardens to an entrance framed by a koi pond, stone flooring and soaring ceilings.
At the centre of the home is an expansive living and entertaining level. A stone kitchen fitted with Miele appliances steps down towards the view, incorporating an integrated refrigerator and freezer and a built-in breakfast bar positioned to overlook the harbour.
The adjoining formal dining room opens through a bi-fold wall to a landscaped side courtyard. A substantial living room, anchored by a gas fireplace, also connects to the main terrace, creating a continuous relationship between the interior, gardens and water.
An electrically operated roof allows the terrace to be used in different weather conditions, while automated internal blinds and ducted airconditioning add to the home’s extensive technology and comfort features.
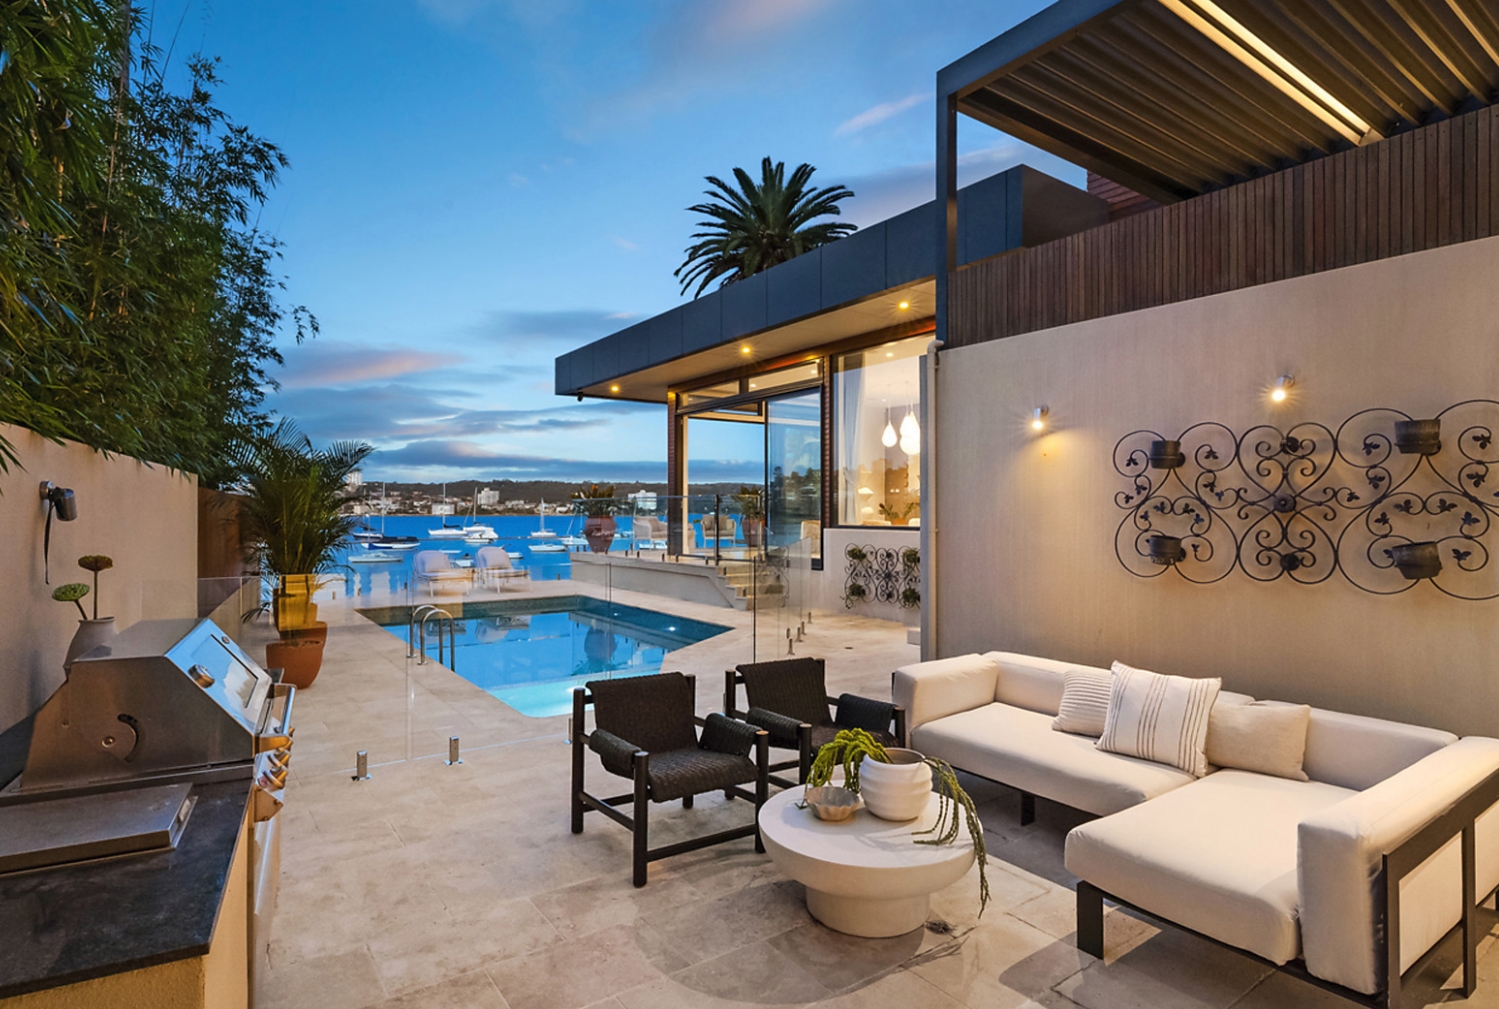
Outside, the entertaining areas continue around a swimming pool and spa. A built-in barbecue, steam room and generous terraces give the property the atmosphere of a private resort, with the beach only steps away.
The accommodation has been arranged to suit a large or multigenerational household.
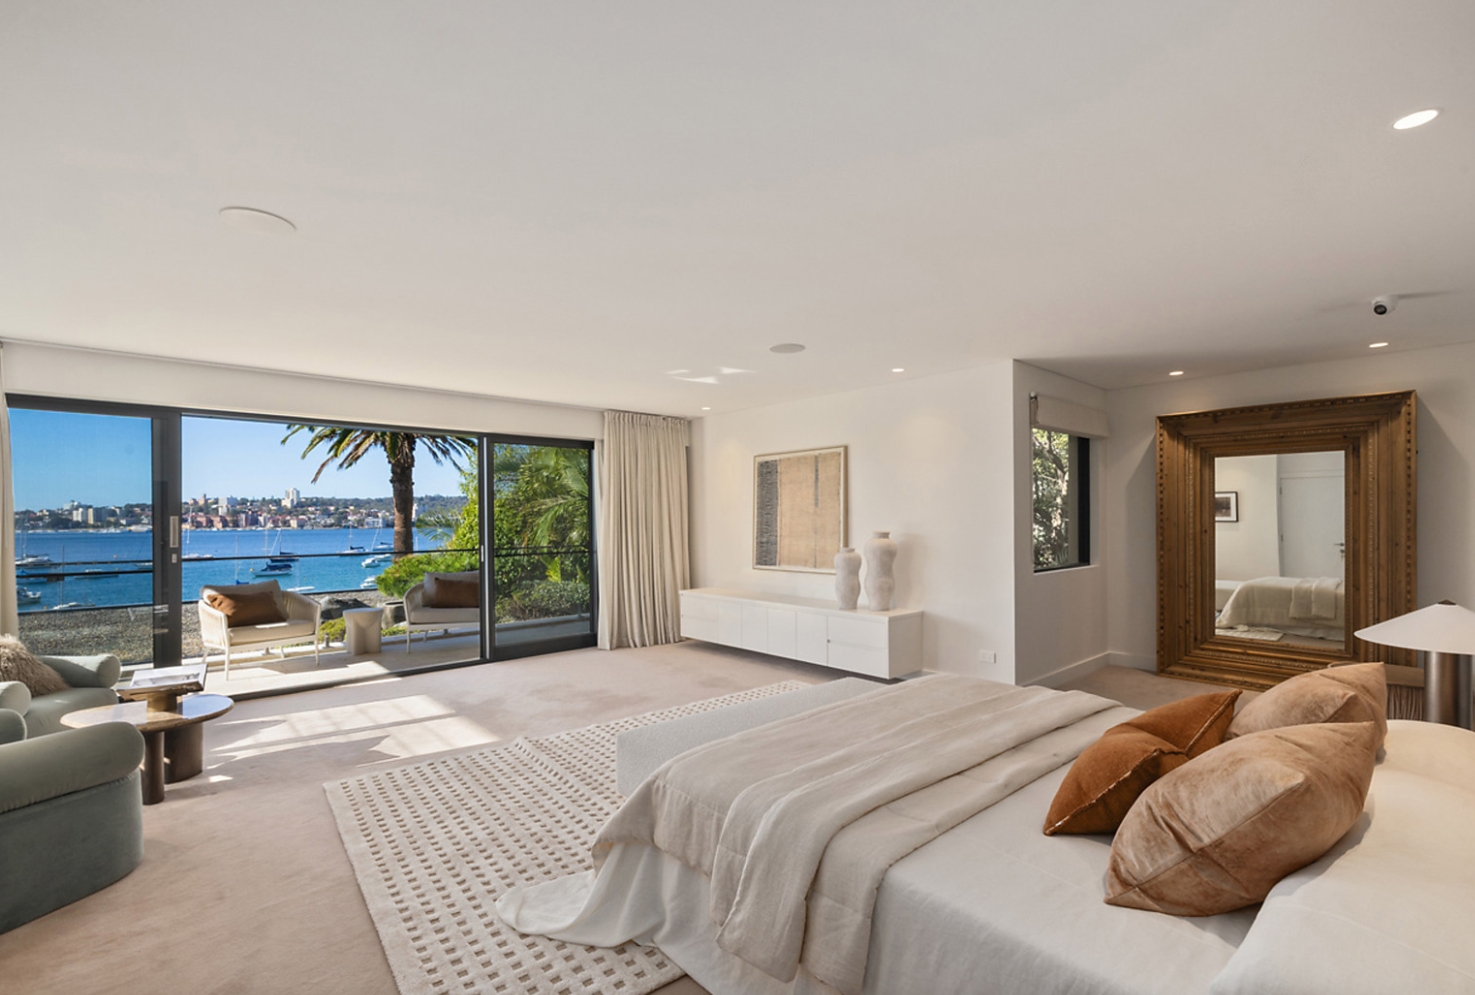
Four bedroom suites occupy an upper level, while the main bedroom commands an entire floor. The private retreat includes sweeping harbour views, a large walk-in wardrobe and a luxurious ensuite.
On the lower level, a billiard room and bar are accompanied by two bedrooms and a bathroom. A separate self-contained studio provides further flexibility for extended family, guests or live-in staff.
The residence also includes a private home office, yoga room and extensive storage—features that allow it to function as both a secluded family home and a large-scale entertaining destination.
Sustainability and energy resilience have also been incorporated through solar panels and a Tesla battery.
Despite its rare waterfront setting, the property remains close to the conveniences of the lower Northern Beaches. Bus services are approximately 450 metres away, while Balgowlah Village, local schools and North Harbour Reserve are within easy reach. Manly is about three kilometres from the home.
The sale underlines the scarcity premium attached to Sydney homes combining substantial land, direct beach access and uninterrupted harbour views.
Balgowlah Heights has a median house value of about $4.23 million, according to PropTrack data displayed on realestate.com.au. At more than four times that figure, the Beatty Street result sits in a different tier from the suburb’s conventional prestige market.
Its price is also $6.65 million above the $10.85 million paid for neighbouring 30 Beatty Street in December 2025.
While conventional luxury features helped support the result, the defining asset is one that cannot be readily replicated: a private rear gate opening directly onto Forty Baskets Beach.
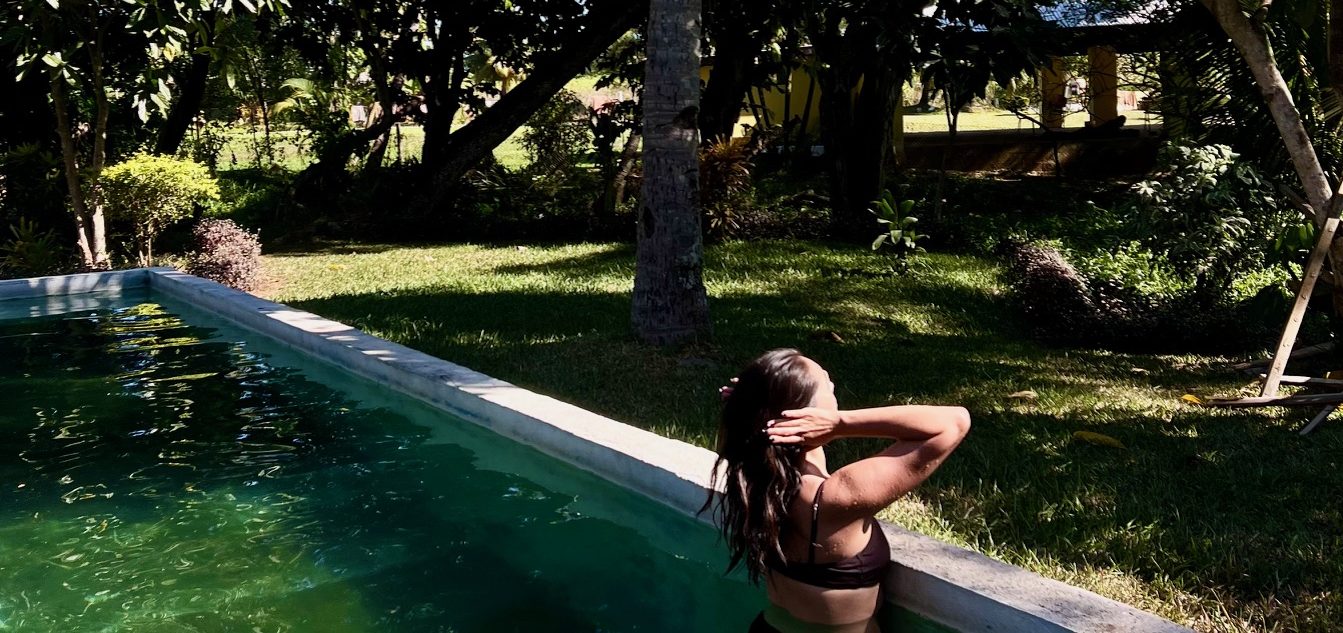
From mud baths to herbal massages, Fiji’s heat rituals turned one winter escape into a soul-deep reset.

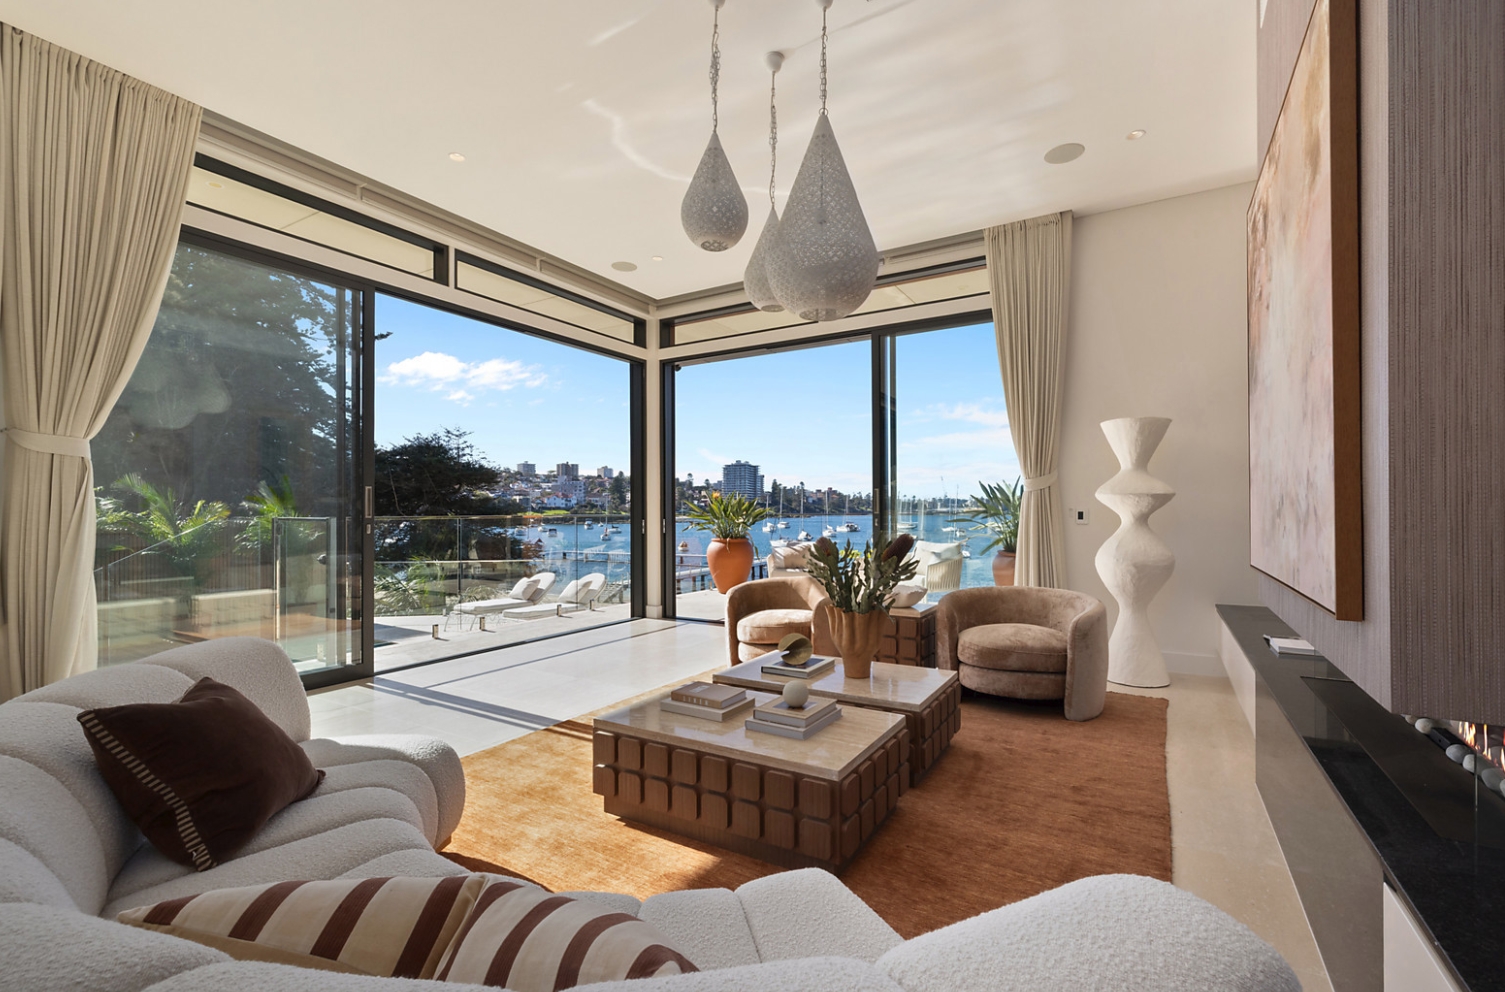
Warmer minimalism, tactile materials and wellness focused layouts are redefining luxury interiors as homeowners design for comfort, connection and lasting appeal.