The $65 Million Perk for CEOs: Personal Use of the Corporate Jet Has Soared
Company spending on the benefit has climbed 50% since before the pandemic

 5 min
5 min
One of the flashiest executive perks has roared back since the onset of the pandemic: free personal travel on the company jet.
Companies in the S&P 500 spent $65 million for executives to use corporate jets for personal travel in 2022, up about 50% from prepandemic levelsthree years earlier, a Wall Street Journal analysis found. Early signs suggest the trend continued last year.
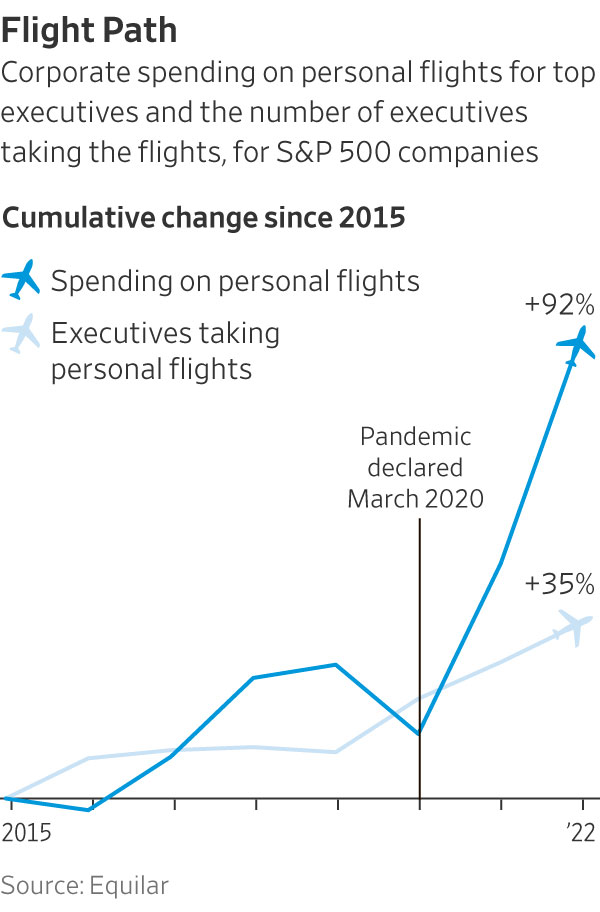
Overall, the number of big companies providing the perk rose about 14% since 2019, to 216 in 2022, figures from executive-data firmEquilar show. The number of executives receiving free flights grew nearly 25%, to 427.
Most companies report executive pay and perks in the spring.
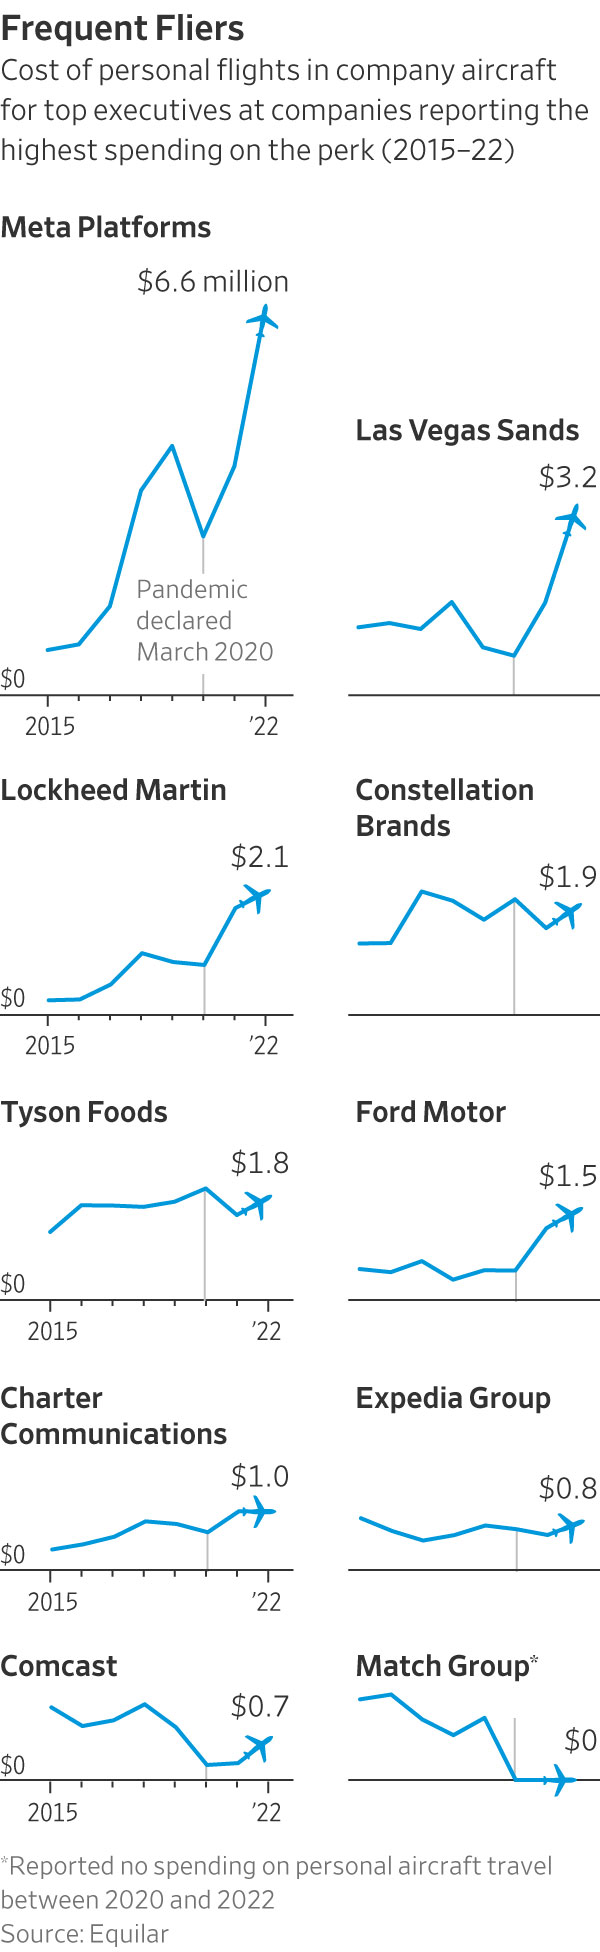
Meta Platforms spent $6.6 million in 2022 on personal flights for Chief Executive Mark Zuckerberg and his then-lieutenant, Sheryl Sandberg—up about 55% from 2019, the Journal found. Casino company Las Vegas Sands spent $3.2 million on flights for four executives, more than double its annual expense in any year since 2015. Exelon, which owns Chicago’s Commonwealth Edison utility, more than tripled its spending on the perk since 2019.
Company jets have long symbolised corporate success and, to critics, excess. Companies typically say flying corporate is safer, healthier and more efficient. Some companies—including Cardinal Health, Raymond James Financial and Hormel Foods—added or expanded the perk in 2020 or 2021, citing pandemic health and safety concerns. Most spending growth came at companies already paying for personal flights in 2019.
Palo Alto Networks began subsidising personal flights for CEO Nikesh Arora in the year ended July 2022, spending about $650,000. That total rose to $1.8 million in its most recent fiscal year, plus a further $286,000 to cover his tax bill for the perk, the cybersecurity company said in an October securities filing.
The company said in filings that its board requires Arora to fly corporate in response to a security consultant’s report. “There was a bona fide, business-related security concern for Mr. Arora and credible threat actors existed with both the willingness and resources necessary for conducting an attack on Mr. Arora,” it said.
Companies report spending on flights they can’t classify as business-related, including trips to board meetings for other companies or commuting from distant residences. Some give executives a fixed personal-flight allowance in hours or dollars, and require reimbursement beyond that.
The sums have little financial impact on most giant corporations, even when annual flight bills exceed a million dollars. Critics say the free flights indicate directors too eager to please top executives.
“The vast majority of S&P 500 companies do not offer this perk,” said Rosanna Landis Weaver, an executive-pay analyst at As You Sow, a nonprofit shareholder-advocacy group that has produced annual lists of CEOs it considers overpaid.
The Journal’s analysis reflects what companies disclose in securities filings, typically in footnotes to annual proxy statements. Federal rules generally require companies to itemize the perk for each top executive if it costs the company $25,000 or more in a year.
PepsiCo spent $776,000 on personal flights for five executives in 2022, double what it paid for the perk in 2019. Two-thirds of the spending subsidized flights by CEO Ramon Laguarta, who is required to use company aircraft for personal flights for safety and efficiency reasons. In an interview last spring, Laguarta said he sometimes ended business trips to Europe by flying to visit his mother in his native Barcelona. She died later in the year, in her 90s.
A PepsiCo spokesman said the company jet allows executives to reach remote facilities.
Personal jet use can draw investor and regulatory scrutiny. It contributed to the ouster of Credit Suisse’s chairman in 2022.
In June, tool maker Stanley Black & Decker settled Securities and Exchange Commission charges that it failed to disclose $1.3 million in perks for four executives and a director, mostly their use of company aircraft, from 2017 through 2020. In 2020, Hilton Worldwide Holdings settled SEC charges that it didn’t disclose $1.7 million in perks over four years, in part by underreporting costs for CEO Christopher Nassetta’s personal flights by 87%in two of those years. Hilton paid a $600,000 penalty.
Both companies settled without admitting or denying wrongdoing.
Stanley Black & Decker said it raised the errors with the SEC and settled without a fine. In 2022, Stanley Black & Decker reported spending nearly $143,500 on personal flights for former CEO James Loree and his successor, Donald Allan Jr., primarily to fly to outside board meetings or from second homes to work.
Hilton cited higher fuel prices in reporting about $500,000 in flights for Nassetta in 2022.
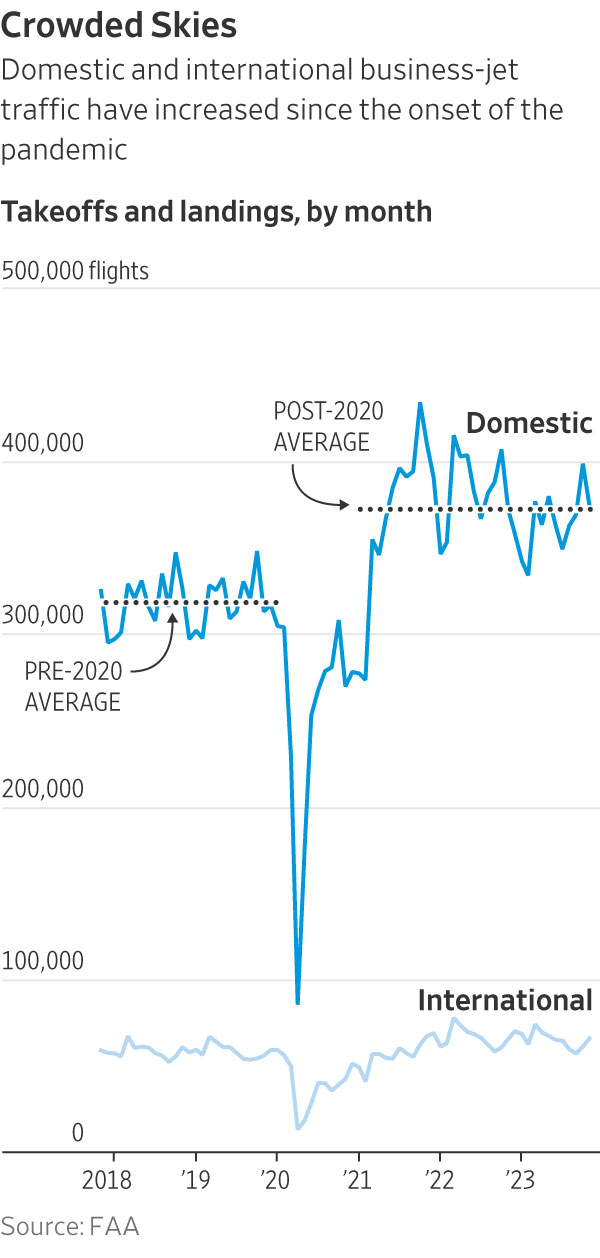
Spending on executives’ personal travel outpaced overall growth in business-jet traffic. Takeoffs and landings are up by about 19% since 2019, after dropping sharply in 2020, Federal Aviation Administration data show. Corporate spending on the perk rose 52%, the Journal found.
Higher fuel costs in 2022 contributed to the increase in spending, and there is little indication of a slowdown last year. Of the 15 S&P 500 companies that have reported spending on the perk in fiscal years ended in the second half of 2023, 10 said they increased spending, including three that didn’t report the perk a year earlier, securities filings show.
Sixteen companies that started paying for personal flights during the pandemic have since stopped. An additional 31 continued spending into 2022, with a median of $124,000. Accenture, Palo Alto Networks and concert promoter Live Nation Entertainment reported spending more than $500,000 apiece.
In 2020, Julie Sweet’s first full year as CEO, Accenture capped annual spending for her personal flights at $200,000, then doubled it the next year. Accenture raised the cap to $600,000 in its year that ended Aug. 31, when it spent about $575,000 on Sweet’s personal flights, the company said in a December securities filing.
In its filings, Accenture said it encourages Sweet to use company aircraft for personal travel, citing a security study the company commissioned.
Companies that provided the perk already in 2019 accounted for most of the recent growth in spending, the Journal found.
Meta, for example, spent nearly $11 million on Zuckerberg and Sandberg’s personal flights from 2015 through 2019, and a further $13.3 million over the next three years. Zuckerberg’s company-paid travel included trips on an aircraft he owns, which Meta charters for business, paying $523,000 in 2022. The Facebook owner stopped paying for Sandberg’s personal flights when she stepped down as a company employee in September 2022. She remains on Meta’s board.
Spokesmen for Meta and Sandberg declined to comment beyond Meta’s securities disclosures.
CEOs incurred most of the personal flight spending, making up half the executives receiving the perk in 2022 and two-thirds of the overall cost, Equilar’s data show.
At some companies, other executives are making up a bigger share of the cost. Four Norfolk Southern executive vice presidents accounted for just over half its roughly $370,000 in spending on personal flights in 2022, securities filings show. CEO Alan Shaw accounted for the rest. By contrast, the railroad reported subsidising flights only for then-CEO James Squires in the five years through 2020.
Shaw may take as many as 60 hours of personal flights on company aircraft before reimbursing Norfolk Southern, the company said in its filings. Personal use of company aircraft by executives other than the CEO was infrequent, it added. Norfolk Southern didn’t respond to requests for comment.
—Jennifer Maloney contributed to this article.
 Copyright 2020, Dow Jones & Company, Inc. All Rights Reserved Worldwide. LEARN MORE





A record-breaking $11 million sale at The Centennial Collection has set a new benchmark for luxury apartment living in Bondi Junction.

As interest rates, inflation and market sentiment fluctuate, investors are being urged to focus on data, not panic.


The Federal Budget may have softened some of its proposed tax reforms, but it has exposed a bigger issue: too many families are relying on wealth structures that no longer reflect the realities of modern life.
3 min
For many Australians, the 2026 Federal Budget initially felt like a direct challenge to the way wealth is created, held and transferred between generations.
The headlines were immediate: changes to capital gains tax, reforms to discretionary trusts, restrictions on negative gearing and increased scrutiny of investment structures. Unsurprisingly, affluent families, business owners and investors began asking the same question:
Is the way we hold our wealth still fit for purpose?
In recent days, the government has announced several significant amendments following industry consultation and public feedback, including exempting testamentary trusts from the proposed 30 per cent minimum tax and expanding capital gains tax concessions for small businesses.
The backdown is welcome. But it also highlights something much bigger.
This Budget has accelerated a conversation that many Australian families have been postponing for years.
The conversation is not really about tax. It is about wealth stewardship.
For decades, Australians have built wealth through businesses, property, investments and careful long-term planning. Yet many families have not revisited the legal structures surrounding those assets in years, sometimes decades.
We often see clients who have spent years building significant wealth, only to discover their legal arrangements no longer reflect their current circumstances.
Their children are now adults. They may own multiple properties.
They may have sold a business, entered a second marriage, become grandparents or accumulated digital assets that did not exist when their original estate plans were prepared.
The trust that distributes income may need to be reconsidered. The bucket company may no longer be so attractive.
The Budget has simply exposed a reality that already existed: wealth structures cannot remain static while life continues to evolve.
Importantly, trusts themselves are not the issue.
Trusts are legitimate planning tools that provide flexibility, protection and continuity. When used appropriately, they allow families to adapt to changing circumstances over time.
And neither is tax the issue, really. Getting the fundamentals right is more important for long-term, sustainable wealth than a few favourable tax treatments around the edges.

The real issue is complacency.
Too often, families create structures and assume the job is done. It isn’t.
Estate planning is no longer a document you sign once and file away in a drawer. It is an ongoing process that should evolve alongside your life.
We are also seeing a broader shift in how Australians define wealth itself. It is no longer just the family home and an investment portfolio.
Modern wealth includes businesses, digital assets, cryptocurrency, intellectual property, frequent flyer points and increasingly complex family arrangements.
At the same time, Australians are living longer than ever before, meaning wealth may need to support multiple generations simultaneously. This creates new responsibilities and new risks.
How do you help your children enter the property market without exposing family wealth to relationship breakdowns?
How do you structure wealth so that it remains a source of opportunity rather than future conflict?
These are the questions families should be asking now.
The recent debate surrounding testamentary trusts also serves as an important reminder that policy decisions can have unintended consequences for vulnerable Australians. It is encouraging that the government has listened to feedback and clarified its position.
But the lesson remains: the wealth landscape is changing.
Increasingly, governments, regulators and tax authorities are paying closer attention to how wealth is held and transferred. That means families cannot afford to adopt a “set-and-forget” approach to their structures.
The families who will be best placed for the future are not necessarily those with the greatest wealth.
They are the families with the greatest clarity. Clarity around ownership, succession and governance. And clarity around how wealth will transition from one generation to the next.
Ultimately, preserving wealth is not about avoiding change.
It is about preparing for it.
Because the greatest risk is not change itself.
It is losing the ability to respond to it.
Anthony Hunt is Co-Founder of Wealth Lawyers and former COO of Westpac Private Bank. He advises business owners, investors and affluent Australian families on wealth protection, succession planning and intergenerational wealth transfer

The megamansion was built for Tony Pritzker, heir to the Hyatt Hotel fortune and brother of Illinois Gov. JB Pritzker.

From gorilla encounters in Uganda to a reimagined Okavango retreat, Abercrombie & Kent elevates its African journeys with two spectacular lodge transformations.