


How Australian spending patterns are changing
There’s a rhythm to the way we choose to spend our money — and businesses are taking notice
 2 min
2 min
October was the month for going out and partying, November saw spending on fashion spike while December shoppers will be turning to credit to have a happy Christmas.
That’s the pattern of spending by Australian consumers for the past three months according to recently released data.
Research from the Commonwealth Bank showed spending on ticketing services rose by 27 percent over October, with tickets to concerts by Oasis, Luke Combs, Metallica and even the F1 in Melbourne proving irresistible for many Australians looking to enjoy themselves.
In November, Black Friday sales — a retail event borrowed from the United States to bridge the day between Thanksgiving and the following Monday — have become a strong feature in Australia in recent years. While the sales events can begin at the start of the month and last for weeks rather than days, the Commonwealth Bank noted 8 of the 12 Household Spending Insights experienced an uptick over the month. This was led by women’s and men’s fashion, with shoppers hoping to take advantage of sales ahead of Christmas.
CBA Chief Economist Stephen Halmarick said in a year where cost of living pressures have been felt across Australian households, the possibility of securing a bargain moved Christmas spending forward.
“We’re seeing Black Friday and holiday spending shift earlier as retailers entice shoppers with early discounts on discretionary items,” Mr Halmarick said. “Collectively, sales for October and November 2024 were up 2 per cent compared to the same period last year.”
With Christmas Day a little over a week away, research by Roy Morgan, commissioned by the Australian Retailers Association showed more than half of Australian shoppers had begun their Christmas spend as early as October. The research also found that Australians are expected to spend $11.8 billion on presents this year, an increase of $1.6 billion on 2023.
Financial comparison service Finder research indicated more Australians will be leaning on credit to cover the shortfall in their budgets this year. The survey of 1009 respondents showed 26 percent regretted not saving more for Christmas, while a further 14 percent felt they had not saved enough.
In contrast, 34 percent revealed they had no need to set aside money for the holidays while another 26 percent had implemented a savings plan over the year to cover costs.
Sarah Megginson, personal finance expert Finder, said Australians struggling with Christmas expenses should avoid racking up debt on credit and instead focus on ways of trimming down costs.
“Many families have very little wiggle room in their budgets this festive season after a surge in living costs,” she said. “When you’re in this situation, planning and comparing to get the best deals and discounts is crucial.
“Avoid extending yourself and ending up with a credit card balance you’re struggling to pay off once the tree has been packed away.”

A long-standing cultural cruise and a new expedition-style offering will soon operate side by side in French Polynesia.

The pandemic-fuelled love affair with casual footwear is fading, with Bank of America warning the downturn shows no sign of easing.


The pandemic-fuelled love affair with casual footwear is fading, with Bank of America warning the downturn shows no sign of easing.
2 minThe boom in casual footware ushered in by the pandemic has ended, a potential problem for companies such as Adidas that benefited from the shift to less formal clothing, Bank of America says.
The casual footwear business has been on the ropes since mid-2023 as people began returning to office.
Analyst Thierry Cota wrote that while most downcycles have lasted one to two years over the past two decades or so, the current one is different.
It “shows no sign of abating” and there is “no turning point in sight,” he said.
Adidas and Nike alone account for almost 60% of revenue in the casual footwear industry, Cota estimated, so the sector’s slower growth could be especially painful for them as opposed to brands that have a stronger performance-shoe segment. Adidas may just have it worse than Nike.
Cota downgraded Adidas stock to Underperform from Buy on Tuesday and slashed his target for the stock price to €160 (about $187) from €213. He doesn’t have a rating for Nike stock.
Shares of Adidas listed on the German stock exchange fell 4.5% Tuesday to €162.25. Nike stock was down 1.2%.
Adidas didn’t immediately respond to a request for comment.
Cota sees trouble for Adidas both in the short and long term.
Adidas’ lifestyle segment, which includes the Gazelles and Sambas brands, has been one of the company’s fastest-growing business, but there are signs growth is waning.
Lifestyle sales increased at a 10% annual pace in Adidas’ third quarter, down from 13% in the second quarter.
The analyst now predicts Adidas’ organic sales will grow by a 5% annual rate starting in 2027, down from his prior forecast of 7.5%.
The slower revenue growth will likewise weigh on profitability, Cota said, predicting that margins on earnings before interest and taxes will decline back toward the company’s long-term average after several quarters of outperforming. That could result in a cut to earnings per share.
Adidas stock had a rough 2025. Shares shed 33% in the past 12 months, weighed down by investor concerns over how tariffs, slowing demand, and increased competition would affect revenue growth.
Nike stock fell 9% throughout the period, reflecting both the company’s struggles with demand and optimism over a turnaround plan CEO Elliott Hill rolled out in late 2024.
Investors’ confidence has faded following Nike’s December earnings report, which suggested that a sustained recovery is still several quarters away. Just how many remains anyone’s guess.
But if Adidas’ challenges continue, as Cota believes they will, it could open up some space for Nike to claw back any market share it lost to its rival.
Investors should keep in mind, however, that the field has grown increasingly crowded in the past five years. Upstarts such as On Holding and Hoka also present a formidable challenge to the sector’s legacy brands.
Shares of On and Deckers Outdoor , Hoka’s parent company, fell 11% and 48%, respectively, in 2025, but analysts are upbeat about both companies’ fundamentals as the new year begins.
The battle of the sneakers is just getting started.
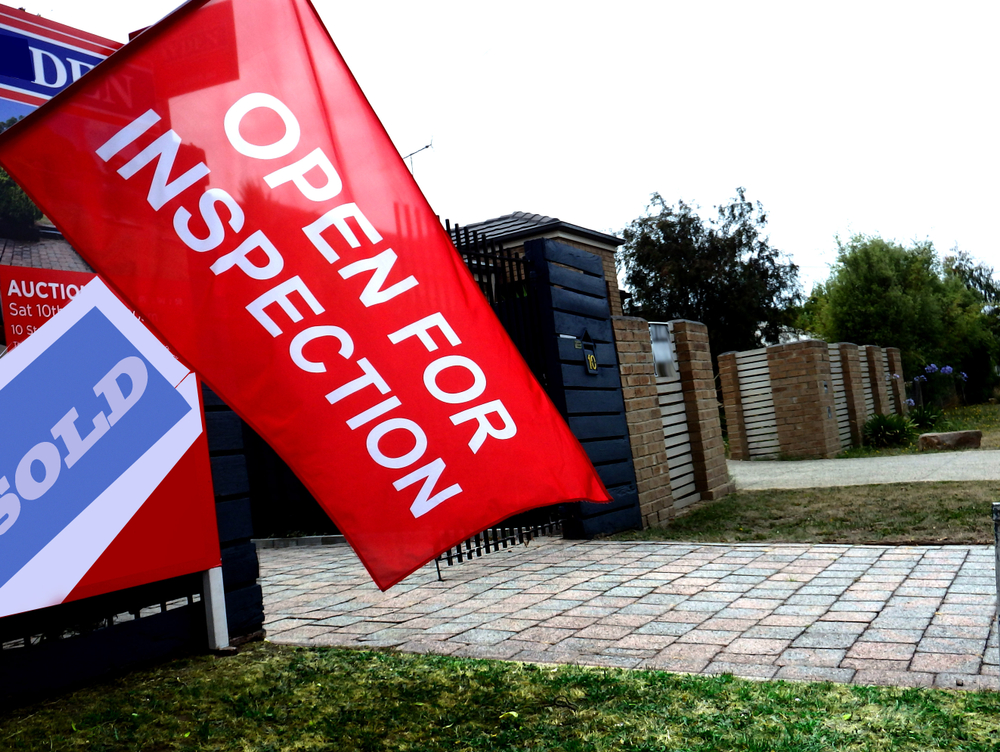
Australia’s housing market rebounded sharply in 2025, with lower-value suburbs and resource regions driving growth as rate cuts, tight supply and renewed competition reshaped the year.
A long-standing cultural cruise and a new expedition-style offering will soon operate side by side in French Polynesia.