I Said Yes to Every Upgrade in Las Vegas. Here’s What It Cost.

 4 min
4 min
LAS VEGAS—Few places vacuum money from you like this glittering gambling and entertainment playground. That’s true for the visitors in town for Sunday’s Super Bowl —official motto: Excessive Celebration Encouraged. And it’s true for visitors any time, with the $US200 seats at the pool and the $US800 bottle service at nightclubs. All before you step onto the casino floor. You can fly here for as little as $US50 if you play your cards right. But people come to Vegas to spend, and the businesses here know it. This place hits travellers with potential upgrades every few steps. So I flew in for an experiment, a real-life version of the Jim Carrey comedy “Yes Man” (or “Yes Day” if you’re a Jennifer Garner fan). I said yes to every upgrade and VIP package to see just how much you get for your money, and what can be skipped. I had parameters. The $US3,999 helicopter ride to the top of Valley of Fire State Park for yoga was out. As was the $US4,000-a-night upgrade offer to a three-bedroom presidential suite at my hotel. Still, I cut lines, got a massage in the reserved seats at the Aria sportsbook during an NFL wild-card game, relaxed in a private lounge before a show at the Sphere , and drank a French 75 from a prime window seat at the Eiffel Tower Restaurant. In all, I spent $US976 to upgrade my Vegas visit. Was every upcharge worth it? Absolutely not. But a few are worth your money.
Yes, yes and yes
The offers began minutes after I booked a room for two nights at the luxury all-suite Palazzo resort. The price: $US480 before taxes and fees for two nights, a relative bargain on a holiday weekend in January. How much for a room booked last-minute for Super Bowl weekend? $US1,700 a night. I landed two upgrades after an email prompt gauged my interest: $US75 for early check-in and $US57 a night for a city view, the cheapest room category upgrade. Early check-in fees irk me , but this was worth it after my early flight. I was in the room by 11 a.m. The room was swank. The view of Treasure Island and the Mirage was nothing special.

I headed to Area15, an arts and entertainment complex. First stop: Meow Wolf ’s Omega Mart, a popular immersive art experience that takes visitors into a bizarro grocery store that links to an alternate dimension. Admission is $US54; upgrading to a $US99 VIP package promised to “enhance my experience” but bought me a souvenir pin, VIP lanyard, a cocktail and a 15% discount I didn’t use at the gift shop. Maybe the good stuff comes with the $US129 scavenger hunt package. (As I perused products like cans of faux La Croix in mashed-potato flavour and wandered a dizzying hall of mirrors, I wondered how many visitors upgraded with a trip to a local dispensary beforehand.) Admission to stroll around the rest of Area15 is free, but I upgraded to a $US35 pass, which included five attractions, the best of which was the outdoor Liftoff ride with great views of the Strip.
Cutting lines for crab legs
Many resorts here gave up the buffet business for good during the pandemic . The Wicked Spoon buffet at the Cosmopolitan of Las Vegas still packs them in. Saturday brunch had an hourlong wait during my visit. VIP line to the rescue! $US35 gets you a head start on the $US62 all-you-can-eat feast of snow crab legs, sushi and slow-roasted strip loin. The best part: The manager overseeing the line comped the fee because she said she enjoyed talking to me and a friend while we waited. (I never identify myself to employees as a Wall Street Journal reporter on these types of assignments.) Suddenly playing with house money, I sprang for the unlimited mimosa package for $US33 after tax and tip, to go with the brunch base price. There is a 90-minute limit, but I had places to be.
One movie, $US245
My colleague Jason Gay calls the Sphere, the giant orb that sits behind the Venetian, a “beach ball peaking on acid.” He paid $US539 to see U2 at the new venue. In the biggest single splurge on my trip, I paid $US245 to see a 50-minute movie there. The Director’s Seat package promised VIP entry, pre show lounge access with free beer, wine and snacks and a souvenir Sphere T-shirt. The VIP entry was the best perk, letting me skip the clogged Regular Joe lines. I was one of the first people in the atrium, where a humanoid robot named Aura chatted with me and a couple from Arkansas who also took the VIP plunge. The robot asked them the secret to their 55-year marriage. We met again in the nearly empty lounge before the Darren Aronofsky show “Postcard From Earth.”
Delta Sky Club this ain’t: The small food spread included soft pretzels with cheese and mustard. The bartender did dig out a great local IPA, Atomic Duck, and pointed me to the popcorn that VIP guests could take into the movie. The package promises premium seating for the show, a trip around the globe in which seats rattled when elephants or a jumbo jet rumbled across the giant screen. My seat was good, albeit one row up and an aisle over from my friends who paid $US79 for their standard tickets. The final Yes Day in Vegas is a spendy blur: $US190 to watch the Lions and Rams duke it out in an NFL playoff nail-biter from a high-top table with food and alcohol included in a roped-off section at Aria Resort & Casino. The rest of the sportsbook was standing room only. Then there was the $US40-a-person fee for the window seat at the Eiffel Tower Restaurant overlooking the dancing Bellagio fountains. The couple celebrating their anniversary one table back couldn’t believe I paid the fee. I left Vegas a little spoiled and out of sorts. When Southwest Airlines offered a $US50 upgrade to jump to the front of its boarding line on my flight home, I clicked buy. Can’t wait to explain that one to the folks in Expense Accounting.
 Copyright 2020, Dow Jones & Company, Inc. All Rights Reserved Worldwide. LEARN MORE


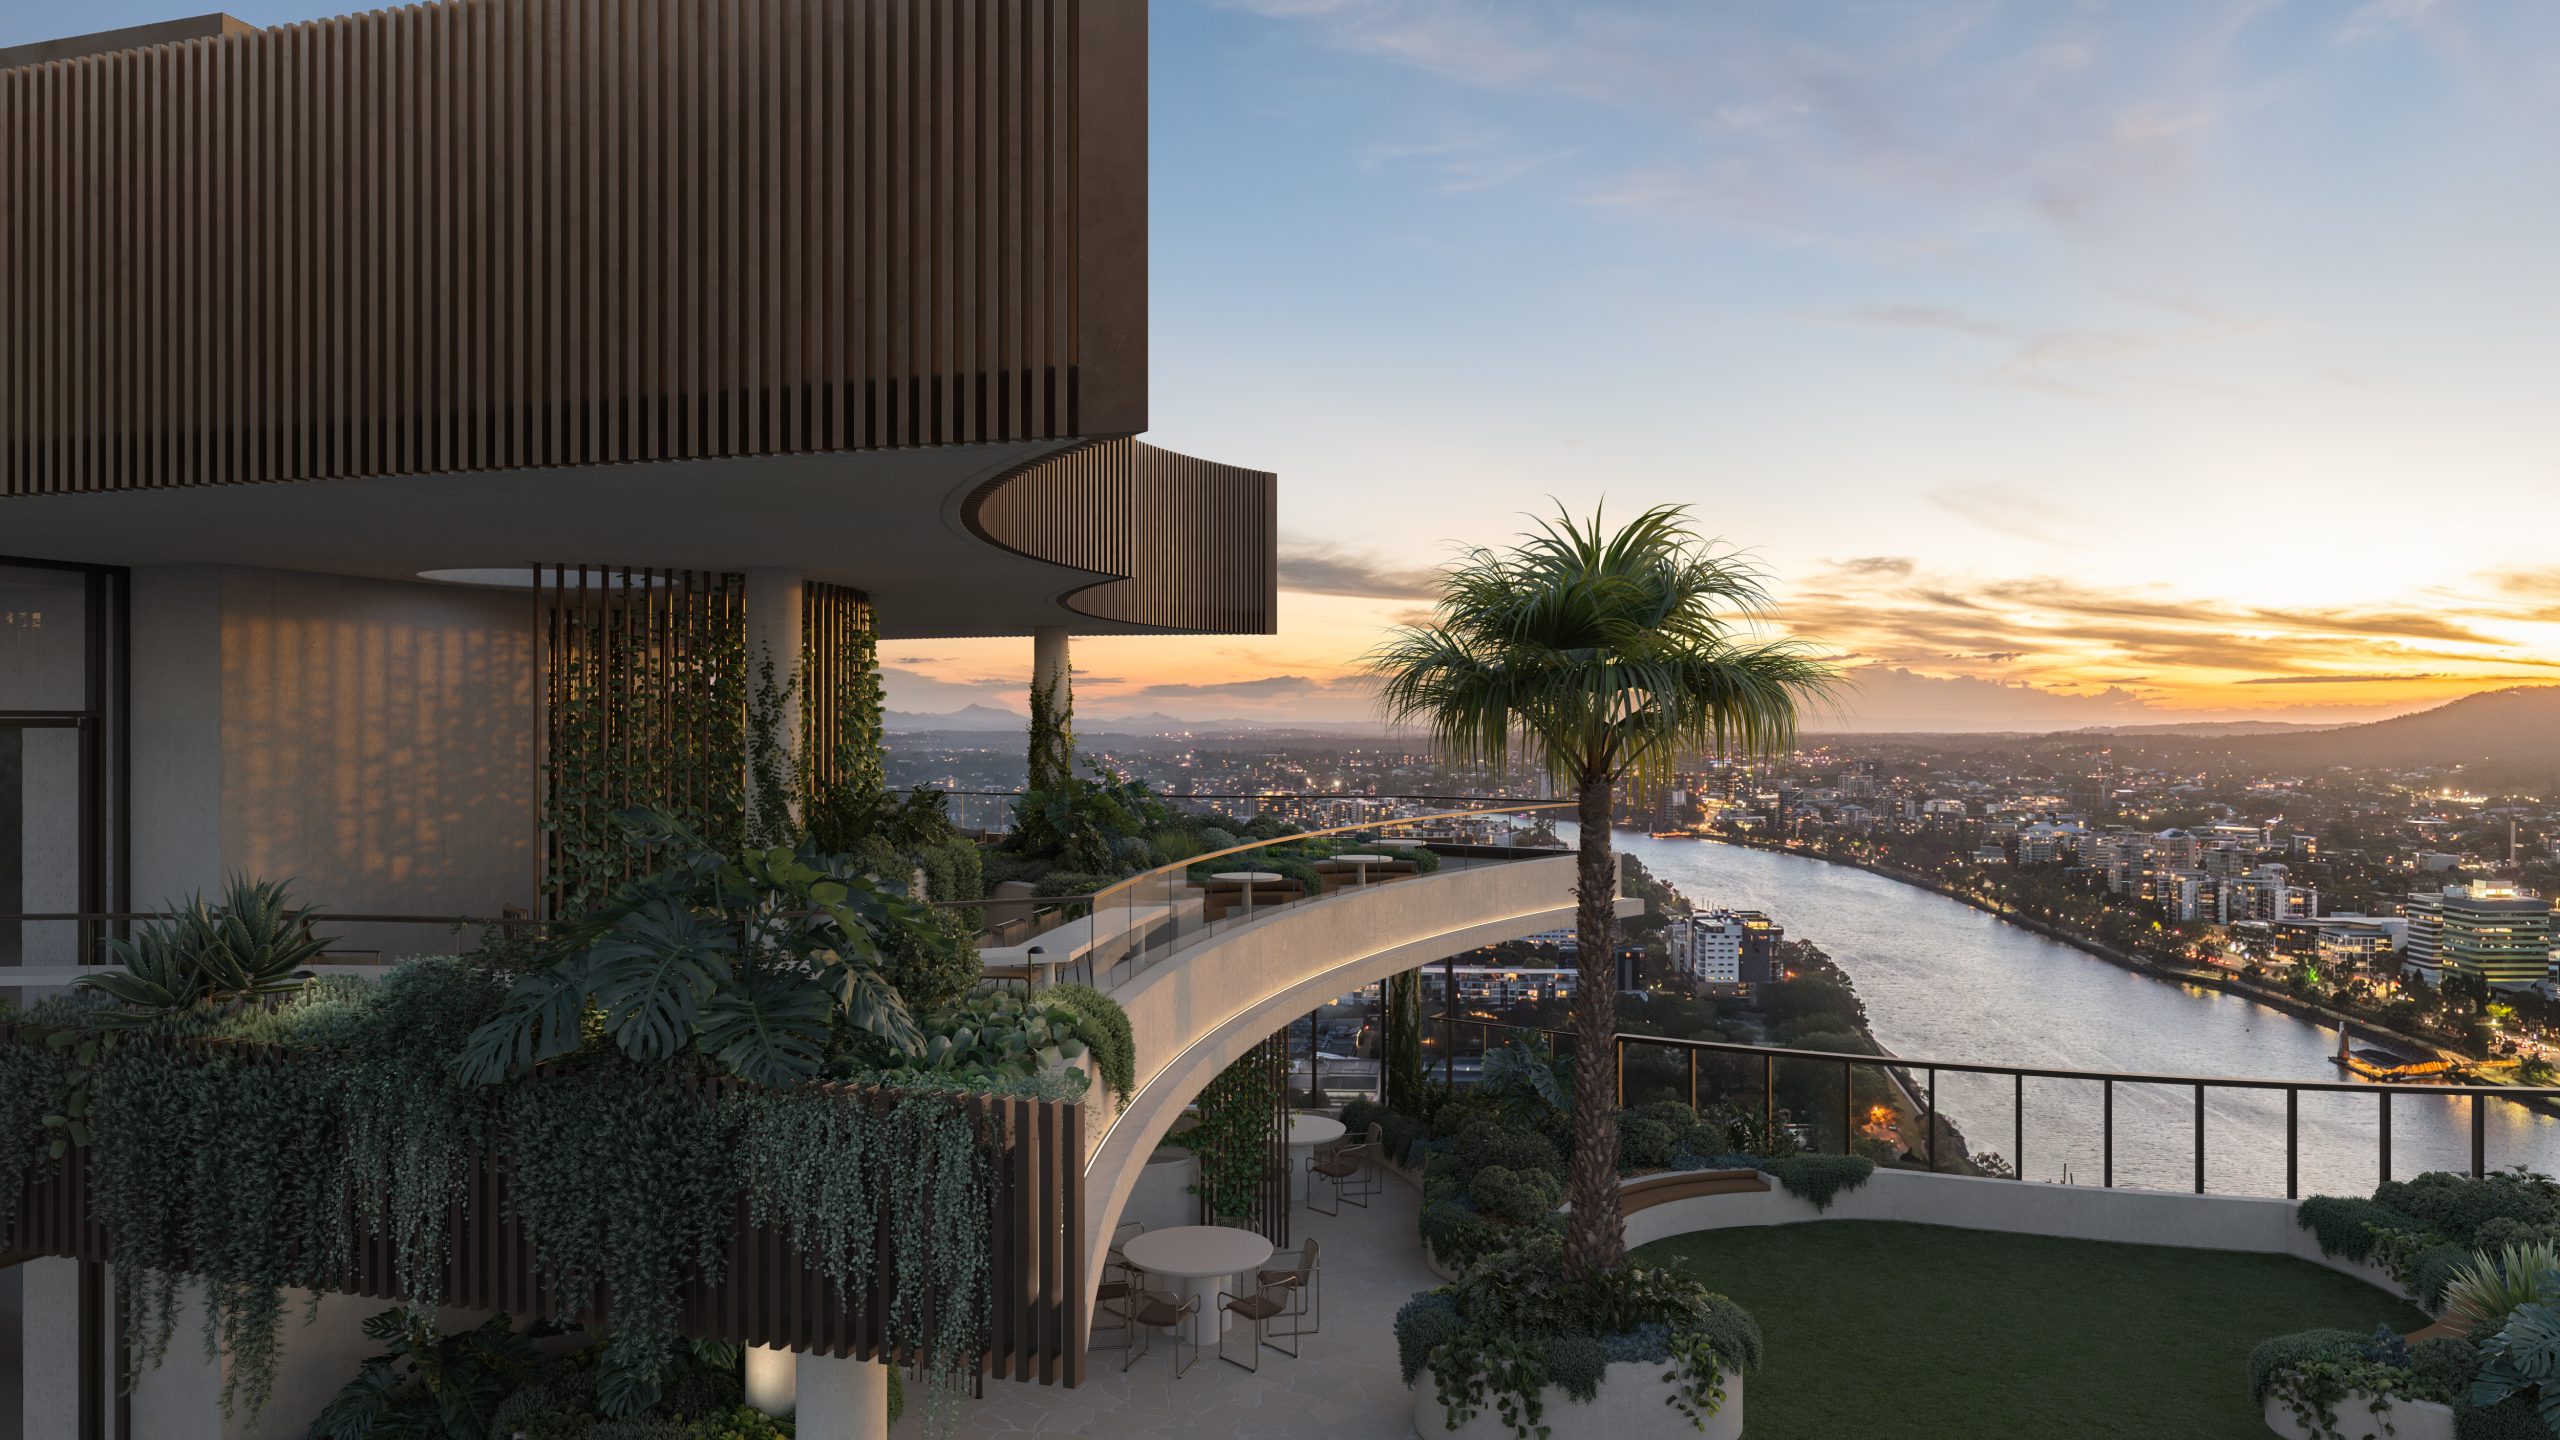
Set on one of the city’s last absolute riverfront sites, The Riversdale by Mosaic combines irreplaceable waterfront ownership with one of Brisbane’s most significant residential opportunities.
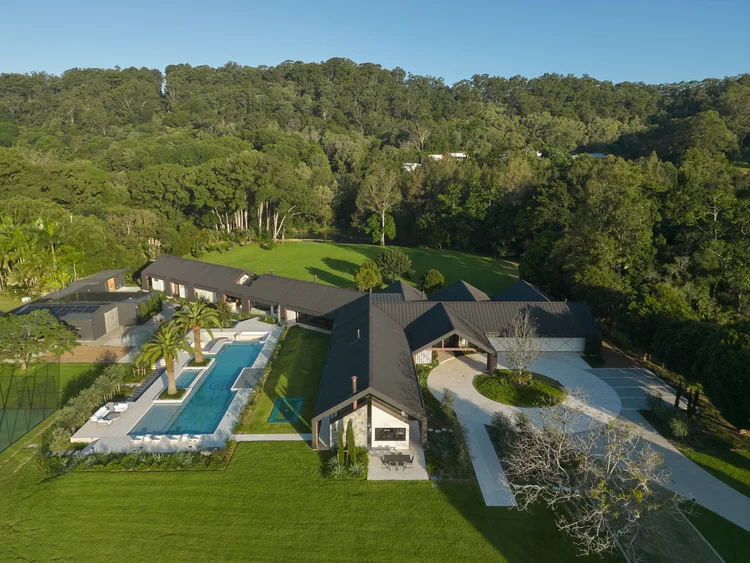
Margot Robbie may have travelled from a Queensland farm to the highest reaches of Hollywood, but a reported $28 million property deal suggests the Gold Coast has never lost its hold on her. The Australian actor and producer is believed to be the mystery buyer of Redwood, a seven-acre Currumbin Valley estate transformed into the …
Continue reading “Margot Robbie Reportedly Behind $28 Million Currumbin Valley Homecoming”
The federal budget has rattled property investors. But the biggest mistake isn’t the tax changes, it’s the conclusion many are drawing from them.
2 min
The recent budget has forced a reckoning for property investors.
Negative gearing now restricted to new residential builds, the CGT discount gone and on paper, the numbers look different.
And many investors are responding by pivoting toward yield, prioritising cash flow over capital growth in a way that property strategists say misses the point entirely.
“The debate has shifted to yield versus growth as if they are opposing forces,” says Abdullah Nouh, founder of Melbourne-based buyers’ agency Mecca Property Group. “But that framing is itself the mistake.”
Nouh, who works with high-net-worth families and investors on long-term acquisition strategy, argues that capital growth remains the primary driver of genuine wealth creation and that the post-budget environment has made quality assets more important, not less.
The numbers make his case plainly. An additional $500 per week in rental income is welcome. A prestige asset appreciating by $1 million over a market cycle is transformative.
These are not equivalent outcomes, and portfolios built around yield at the expense of location and land value tend to generate income while wealth stands largely still.
The more nuanced shift Nouh is seeing among sophisticated investors is a move toward assets where both outcomes can be engineered simultaneously – established homes on substantial land in quality locations, where the existing dwelling can be repositioned, rental returns improved, and the underlying land value compounds independent of what sits on it.
For investors with existing equity, commercial property is also entering the conversation in a more serious way.
Prestige industrial assets, medical centres and long-leased essential retail offer income profiles that residential property in most capital city markets cannot currently match: longer lease terms, tenants covering outgoings, and greater predictability than the residential tenancy cycle.
“The investors who build lasting wealth are rarely the ones who chased yield or growth exclusively,” says Nouh.
“They are the ones who built a strategy they could sustain – one that generated enough income to hold quality assets through multiple cycles while those assets compounded in value.”
The budget has changed the settings. It has not changed the fundamentals.

The PG rating has become the king of the box office. The entertainment business now relies on kids dragging their parents to theatres.

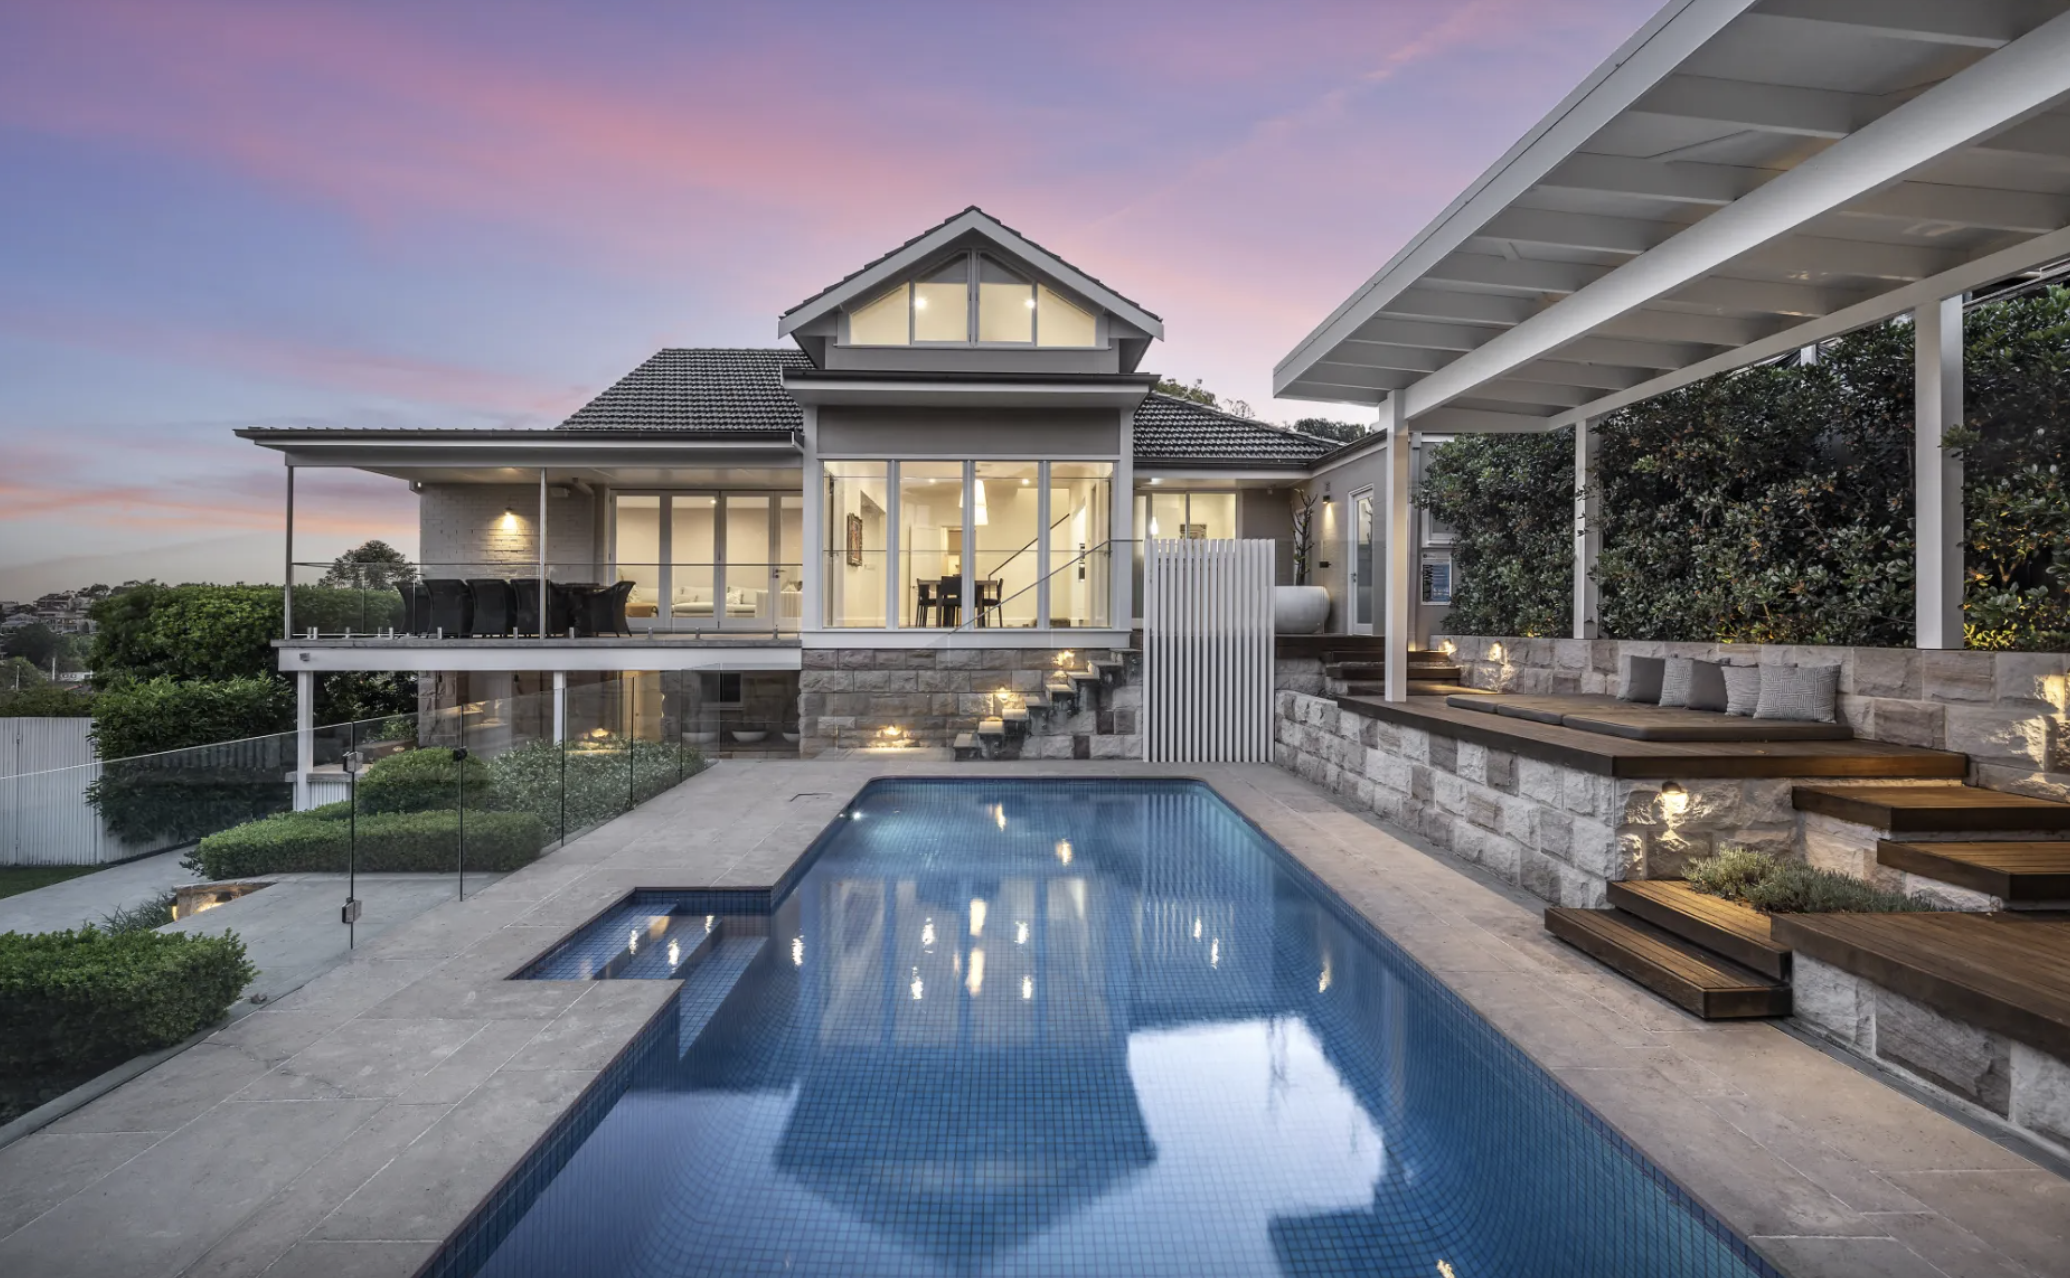
A record-breaking $11 million sale at The Centennial Collection has set a new benchmark for luxury apartment living in Bondi Junction.