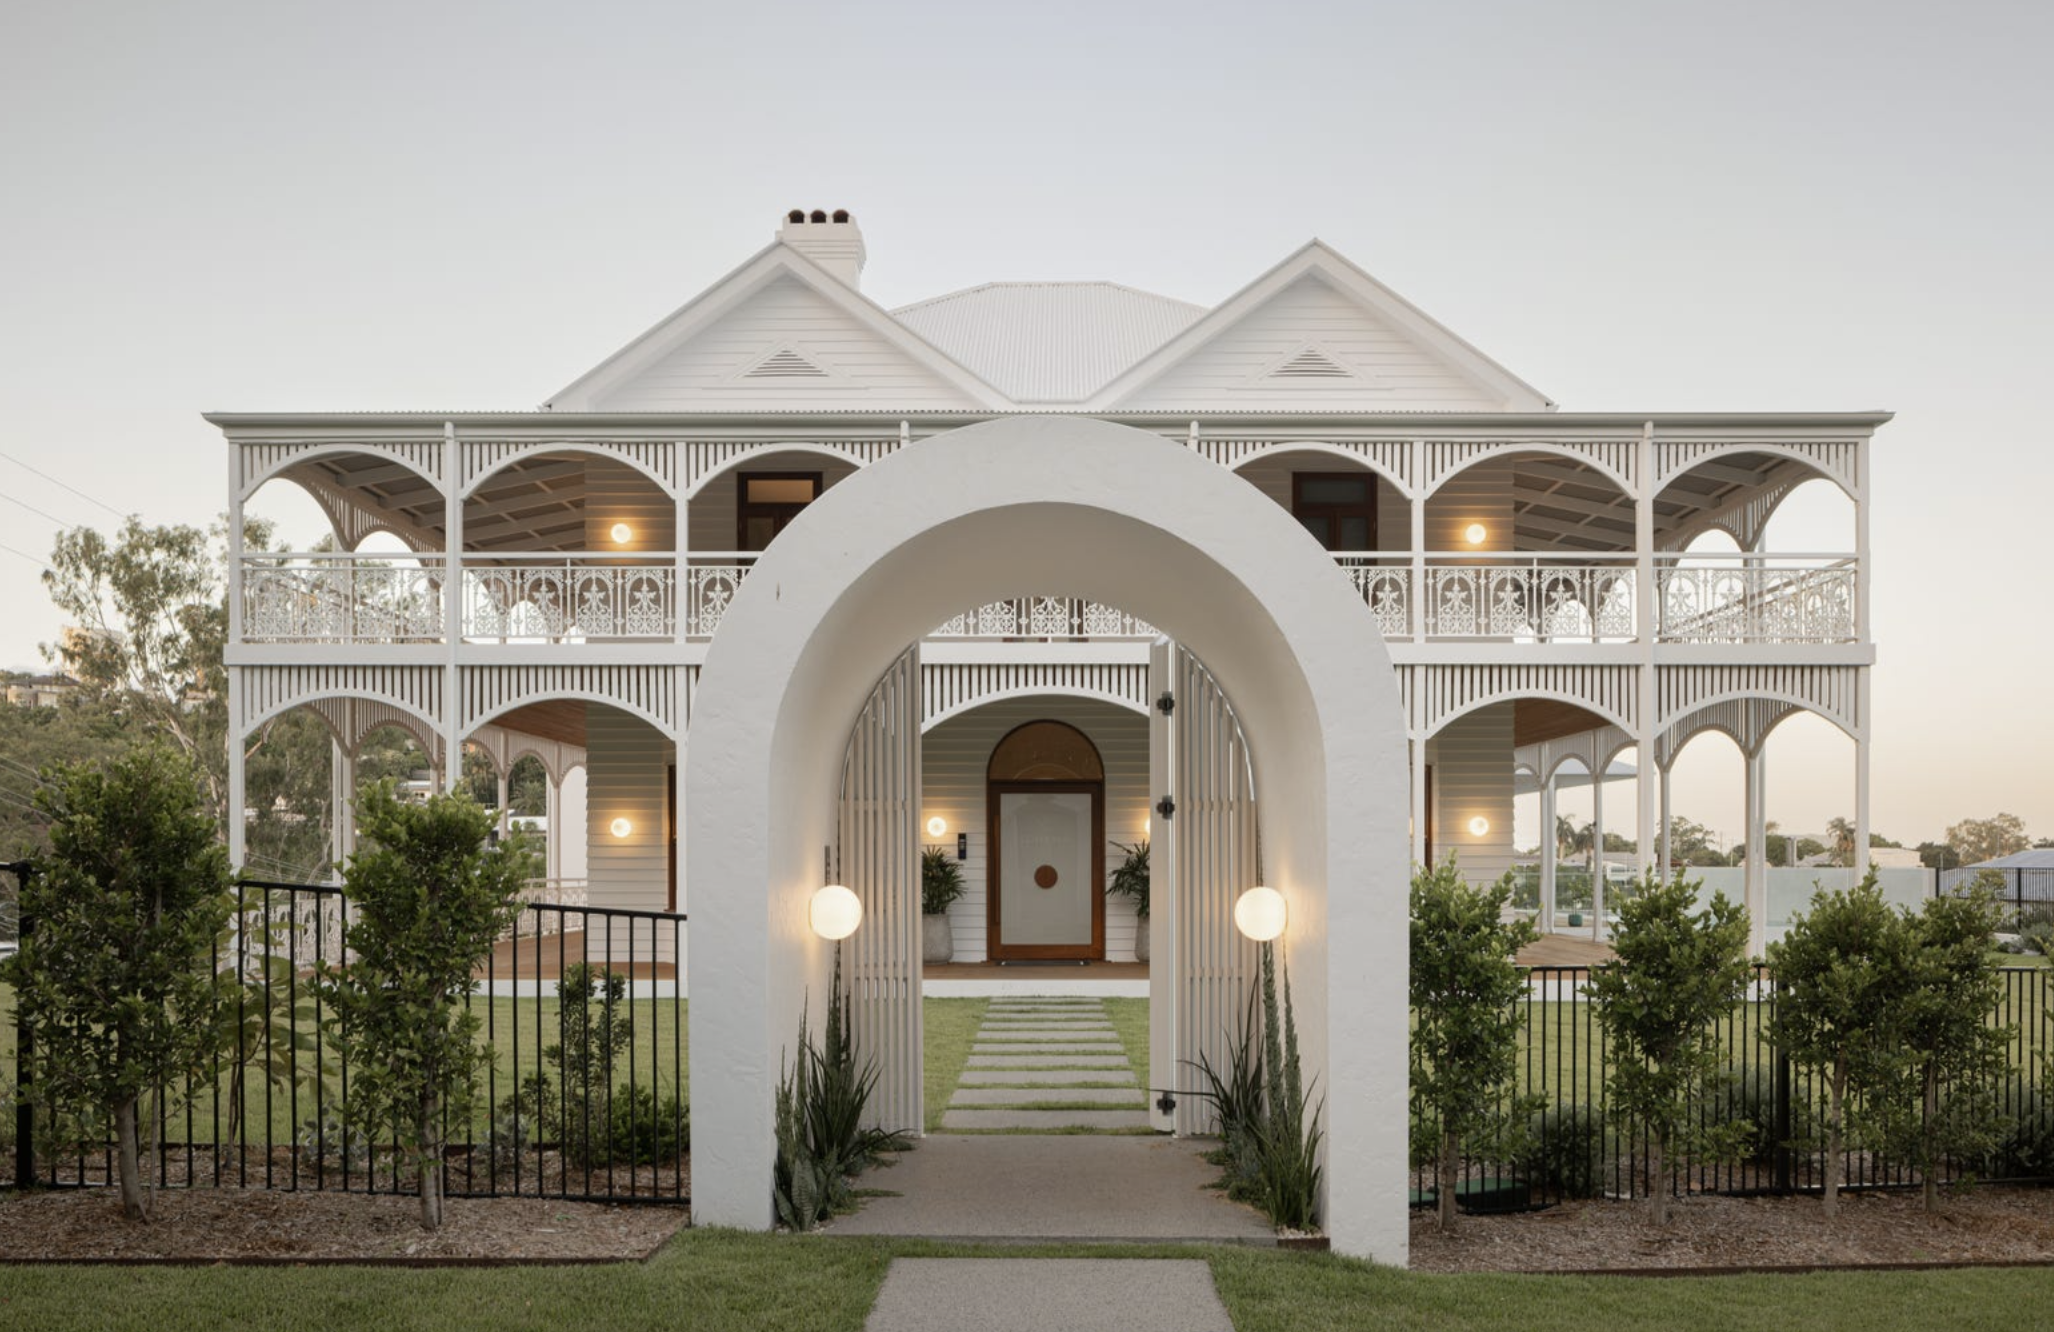
REVEALED: WHAT DEFINES LUXURY & QUALITY OF LIFE AROUND THE WORLD
A luxury lifestyle might cost more than it used to, but how does it compare with cities around the world?
 4 min
4 min
A life of luxury in Australia costs more than it used to in Australia. Inflationary pressures have pushed everything from the price of real estate, extravagant dining experiences and lavish weekends away up higher than they’ve ever been before.
The price tag for luxury homes across Australia now starts at $2.52 million, up an eye watering 72 per cent from a decade ago.
But what counts as luxury varies significantly depending on location. Sydney remains Australia’s most expensive market, where luxury begins at $4 million. The Gold Coast has now taken second place at $2.6 million, pushing ahead of Melbourne’s $2.49 million entry point.
That’s according to Luxury Report, produced by real estate firm Ray White, analysed what defines luxury today.
Global comparison
Housing affordability continues to hover at crisis levels in Australia, but how does a luxury lifestyle in Australia compare with the rest of the world?
A look at real estate markets abroad quickly reveals that where you choose to live can have a huge impact on what it costs to put a roof over your head.
For example, in Monaco, a small apartment can set you back more than $38,800 per square metre. Here, more than 40 per cent of the nation’s residents are millionaires: the highest proportion of any city in the world.
According to the ninth edition of a report that offers a snapshot of how global cities compare on cost of living, quality of life and income and affordability, Sydney and Melbourne isn’t anywhere near as expensive as other cities around the world.
Which puts it perspective for the wealthy trying to grapple with whether or not they can afford to keep the holiday house, or whether to list it for sale.
The Mapping the World’s Prices 2025 report ranked the cheapest and most expensive cities around the world, with the Deutsche Bank Research Institute assessing global cost and quality of life indicators.
The report tracks what it costs to enjoy a luxurious lifestyle. This includes the prices of everything from groceries, wine, buying a city apartment, salaries and general measures of the quality of life. Other factors measured include the cost of a summer dress, a carton of cigarettes, internet data and what it costs to dine out in some of the best restaurants.
Produced by the Deutsche Bank Research Institute, the report points out that inflation making a roaring comeback over the last five years, currency swings are influencing purchasing power and the world’s cost of living leaderboard is therefore shifting quickly.
Researchers focused on the 69 cities that matter most to global financial markets, and therefore your investment portfolio.
Here’s a breakdown of the most expensive places to live around the world:
Quality of life
If you’re seeking a good quality life, the top five cities for a quality lifestyle listed in the report are Luxembourg, Copenhagen, Amsterdam, Vienna and Helsinki.
Meanwhile, Zurich and Geneva have slipped out of the top five because cost of living pressures have continued to skyrocket, making these cities now the most expensive in the world to live in.
Buying an apartment
Prices for an apartment have fallen by 20 per cent in Hong Kong over the last five years, but still top the list, followed by Zurich, Singapore, Seoul and Geneve.
London and New York are just outside the top five, while Beijing comes in at ninth place, highlighting the elevated property prices in China. If you’re looking to buy an apartment, unit or townhouse in Australia, the median price in July 2025 was $686,399.
Utility bills
Electricity bills cost around $350 to $420 per quarter in most states of Australia, which is much cheaper than what Germans are forking out. Munich, Frankfurt and Berlin have the highest energy bills in the world, while Warsaw, Vienna and Prague also make the top 10, highlighting that Eastern European cities are counting the costs of the lack of cheap Russian gas.
iPhone
If you want to pick up a smartphone to keep in touch with loved ones while travelling, you’re going to pay a lot more for one in Turkey, Brazil, Egypt, India and Sweden. Seoul is the cheapest as competition with Samsung makes it even cheaper than in US cities.
Groceries
Geneva, San Francisco, Zurich, New York and Boston are the top five costly places to stock up on groceries. Even by Swiss standards, groceries in Geneva are generally expensive, while groceries in Sydney are 39.41 per cent lower than in Geneva.
Wine
Picking up a bottle of wine will set you back if you’re in Singapore, where you’ll pay more than anywhere else in the 69 countries surveyed. Jakarta, Seoul, New York and Oslo are also expensive. It’s much cheaper to purchase wine in some other lovely cities, including Rome, Johannesburg, Cape Town, Budapest and Lisbon.
Cigarettes
Incredible, Australia tops the list anywhere in the world for the price of cigarettes. Government taxes and duties applied to cigarettes aim to dissuade consumption mean that Melbourne and Sydney have been ranked as the most expensive place for cigarettes, along with New Zealand.
Restaurants
Eating out in a swanky restaurant in Australia can set you back up to $300 per person. That might sound expensive if you’re trying to feed a family of four, it’s going to be more in Zurich, Geneva, New York, San Francisco and Boston.
Buying a car
Singapore and Copenhagen actively discourage the purchase of cars and are the most expensive cities to purchase a set of wheels. In fact, the cheapest possible car will set you back around $150,000 in Singapore Dollars. That’s for a basic car like a Honda Jazz, which is the same price as a Porche in any other part of the world.
The reason cars are so expensive in Singapore is the huge population in a limited space meaning the government prioritises a clean environment and less traffic. The next most expensive places to purchase a car are Tel Aviv, Istanbul and Abu Dhabi.

From making unpopular decisions to learning when to listen, leaders from five businesses reveal what nobody prepared them for — and how running a company has challenged their expectations.

Technology and semiconductor shares fell sharply as investors questioned the debt financing the AI infrastructure boom and confronted higher rates and Chinese competition.
Technology and semiconductor shares fell sharply as investors questioned the debt financing the AI infrastructure boom and confronted higher rates and Chinese competition.
4 minA sharp technology sell-off has exposed a new anxiety on global markets: whether the enormous borrowing behind the artificial-intelligence infrastructure boom can generate sufficient returns as interest rates rise and Chinese competition intensifies.
The artificial-intelligence investment boom has powered technology shares, semiconductor manufacturers and data-centre operators to extraordinary heights. Last week, investors were given a reminder that much of this expansion is being built with borrowed money.
The technology-heavy Nasdaq Composite fell 4.5 per cent over the week ended October 16, its weakest performance since late June. Semiconductor shares suffered an even deeper correction, with the Philadelphia Semiconductor Index losing about 11.4 per cent.
The selling spread quickly through global markets. Micron Technology fell 14.6 per cent over the week, while South Korea’s Samsung Electronics and SK Hynix dropped approximately 18 per cent and 24 per cent respectively.
This was more than a routine bout of profit-taking. Investors were reassessing three interconnected risks: higher interest rates, the rapidly expanding debt burden attached to AI infrastructure and the prospect of stronger competition from Chinese memory-chip manufacturers.
The debt behind the AI build-out
Artificial intelligence requires a physical infrastructure network of enormous scale. Data centres must be built, advanced processors purchased, power supplies secured and cooling systems installed before customers begin generating meaningful revenue from them.
Technology companies are increasingly supplementing their own cash with corporate bonds, syndicated loans, equipment leases, private credit and project-level financing.
JPMorgan describes the emerging funding model as a combination of conventional corporate borrowing and project finance tied to individual data-centre assets. In Australia, the Reserve Bank estimates that syndicated loans accounted for approximately three-quarters of data-centre financing during 2025 and 2026 to date.
The numbers are becoming large enough to affect broader credit markets. The Federal Reserve Bank of Dallas has cited Wall Street estimates suggesting AI-related investment-grade bond issuance could approach US$300 billion in 2026 alone.
That borrowing is not automatically problematic. Debt can be an efficient way to finance long-lived infrastructure when future revenue is sufficiently predictable. The concern is that AI technology, customer demand and computing economics are changing much faster than the repayment schedules attached to the assets.
A data centre financed today may carry debt for years. Investors must therefore make assumptions about future utilisation rates, electricity prices, chip performance, customer concentration and the amount businesses will ultimately pay for AI computing.
When interest rates rise, those assumptions become less forgiving.
Inflation changes the calculation
September’s US inflation data intensified the pressure. Consumer prices increased 3.7 per cent over the year, ahead of market expectations and up from 3.4 per cent in August.
The hotter reading reduced confidence that interest rates would fall quickly and pushed bond yields higher. That matters particularly for companies whose valuations depend on profits expected well into the future, as well as highly leveraged infrastructure operators that may need to refinance.
CoreWeave has emerged as a closely watched test case. The specialist cloud-computing company has accumulated substantial debt and lease obligations to build AI capacity, while relying on a concentrated group of large technology customers.
Its shares fell sharply during the sell-off, while the cost of insuring its debt against default climbed. CoreWeave has argued that its contracted backlog more than covers its obligations and that financial markets do not always understand its business model. Nevertheless, its securities have become a proxy for investor confidence in debt-funded AI infrastructure.
Oracle, another major investor in AI computing capacity, fell 8.8 per cent in Friday trading, while CoreWeave dropped 15.5 per cent.
The question is shifting from how much AI infrastructure can be built to how profitably it can be operated.
China adds another source of pressure
Interest rates were not the only catalyst. Reports of advances by Chinese memory-chip producer ChangXin Memory Technologies raised concerns that lower-cost Chinese products could increase competition across the global semiconductor industry.
Memory chips are essential to AI systems, but the industry is historically cyclical. Periods of tight supply and high pricing can encourage rapid investment, eventually producing oversupply and falling margins.
The prospect of a well-funded Chinese competitor expanding its technological capabilities unsettled investors in Samsung, SK Hynix and Micron. It also demonstrated that AI-related demand does not insulate chipmakers from conventional competitive pressures.
That combination—slower rate cuts, more expensive financing and potentially cheaper supply—challenged the assumption that every company exposed to AI would enjoy continually expanding margins.
A reset rather than the end of the boom
The sell-off does not establish that the AI boom is ending. Demand for computing power remains strong, the largest technology companies continue to generate formidable cash flows and many infrastructure projects are backed by long-term customer contracts.
What has changed is the market’s willingness to overlook the price and financing structure of that growth.
The most resilient companies are likely to be those able to fund investment from operating cash flow, secure long-duration customers and demonstrate that new capacity will earn returns comfortably above its financing costs.
More speculative operators may face greater scrutiny, particularly where debt is expensive, customers are concentrated or expected revenue depends on demand that has not yet materialised.
For Australian investors, the lesson extends beyond US technology shares. Local data-centre operators, infrastructure funds, electricity suppliers and property groups are increasingly exposed to the same investment cycle.
Artificial intelligence may remain one of the defining growth themes of the decade. But last week’s correction showed that enthusiasm for the technology does not eliminate financial discipline.
The next stage of the AI boom will be judged not only by computing power, model performance or demand for chips, but by something more traditional: whether the assets being financed can generate enough cash to repay the money borrowed to build them.
Fact box
Nasdaq Composite: Down 4.5 per cent for the week ended October 16, 2026
Philadelphia Semiconductor Index: Down approximately 11.4 per cent
Micron Technology: Down approximately 14.6 per cent
Samsung Electronics: Down approximately 18 per cent
SK Hynix: Down approximately 24 per cent
US September inflation: 3.7 per cent annually
Estimated 2026 AI-related investment-grade issuance: Approximately US$300 billion
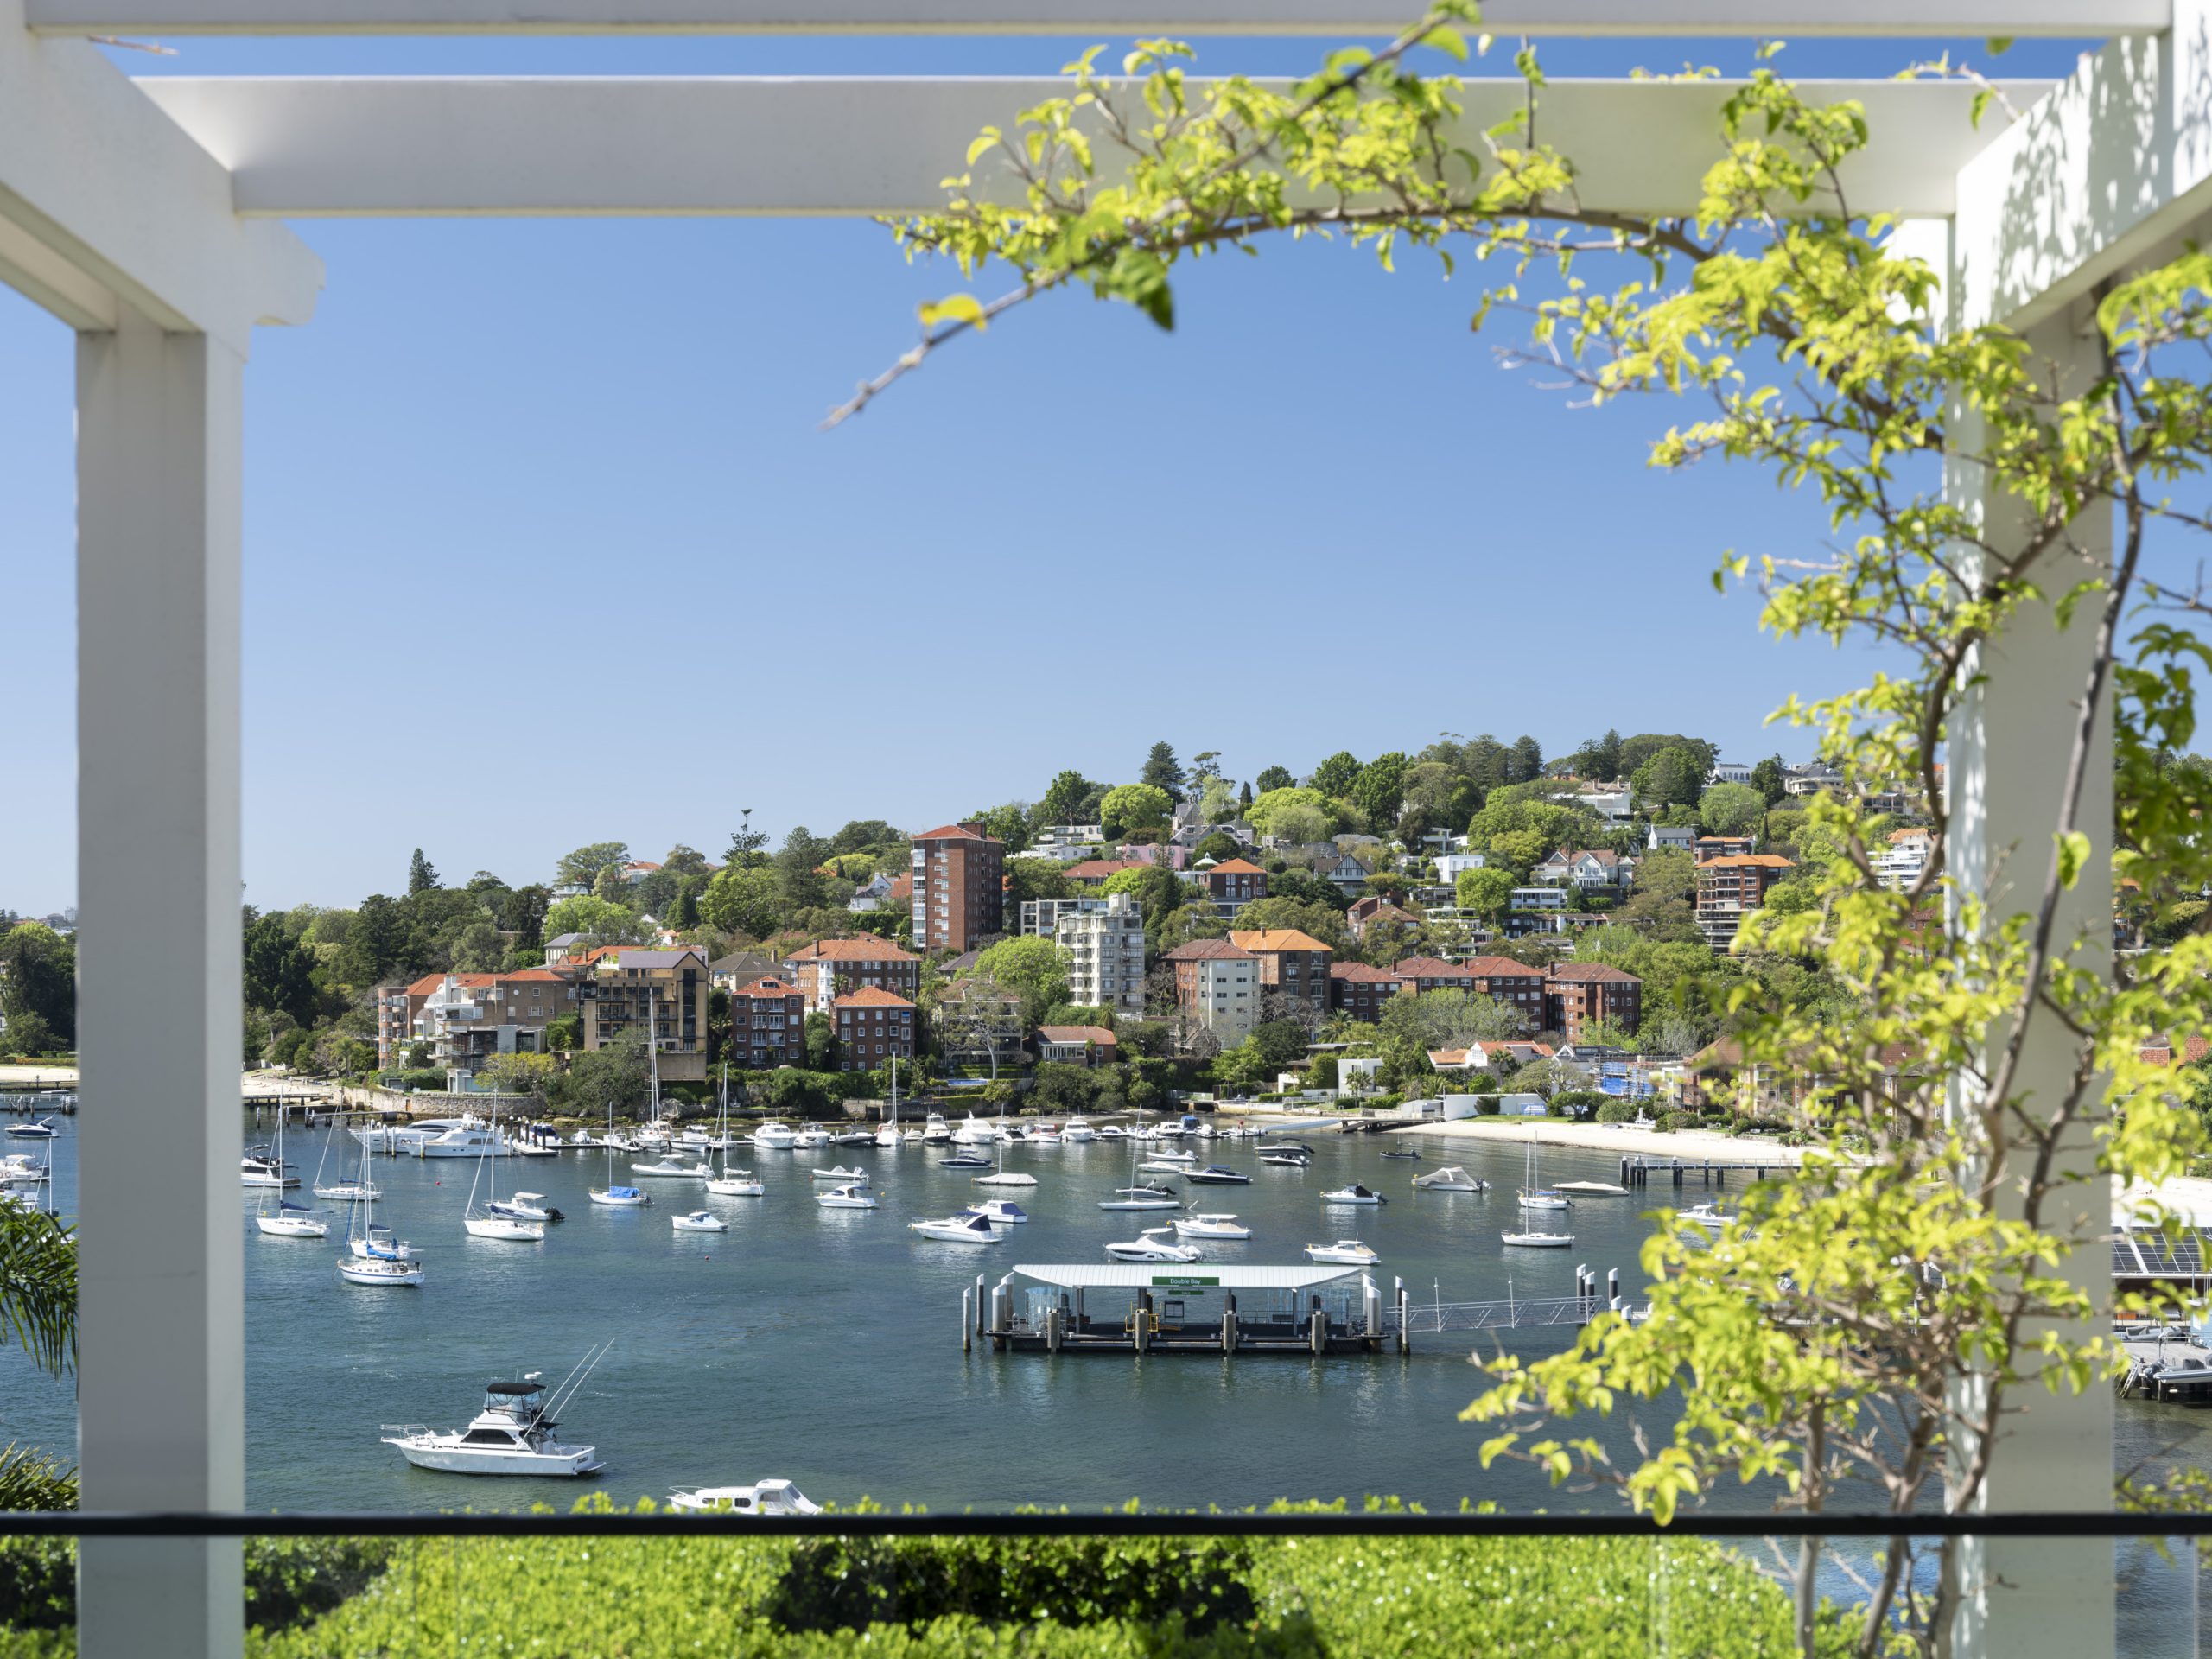
The grand harbourside residence combines sweeping Sydney Heads views, resort-style entertaining and refined designer finishes with a reported $36 million price guide.

From citrus oils to warming spices, the classic G&T is being reimagined at home as a more thoughtful, seasonal ritual for modern entertaining.