Stocks Are Crashing—That’s a Great Reason to Sit Tight
The sudden selloff in Japanese equities and a surge in the VIX suggest the current rout is being exaggerated by trend chasers

 4 min
4 min
The red numbers in your 401(k) today might appear to vindicate warnings about an artificial-intelligence bubble and infirm economy. But don’t tilt your portfolio toward full pessimism just yet.
The S&P 500 was down 3% Monday, with the Nasdaq falling even further. Investors have been selling the year’s best performers, concerned that disappointing second-quarter results from big technology companies such as Alphabet , Tesla and Intel are a sign that the AI frenzy is a fad. Also, consumer discretionary stocks have become the worst-performing sector in the S&P 500, as lacklustre labour-market reports have raised worries that the Federal Reserve made a mistake by waiting until September to cut interest rates.
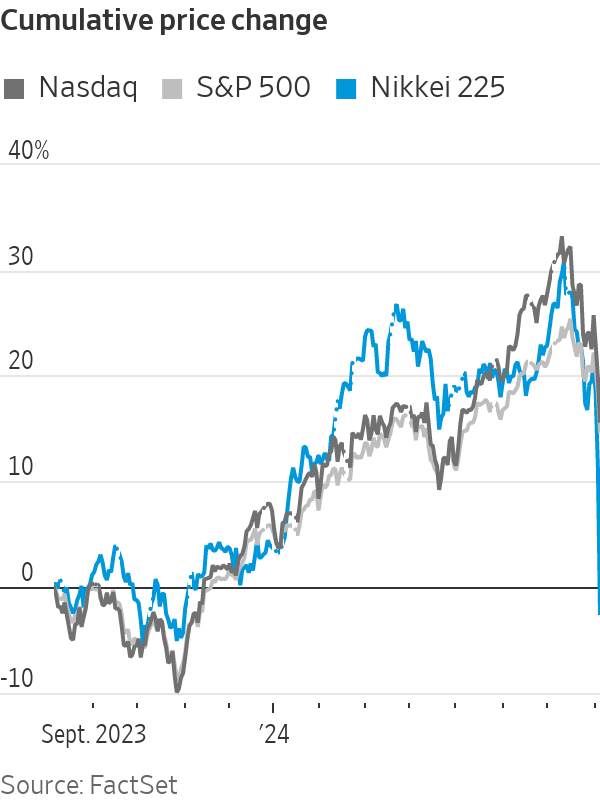
Overseas, the Stoxx Europe 600 closed almost 5% below where it was a week ago, whereas the Swiss franc, a common haven asset, is up roughly 4%. The most eye-popping moves happened in Asia, though, where the Nikkei 225 plunged 12.4% Monday in the worst trading session since Oct. 20, 1987—the day that followed Wall Street’s infamous Black Monday.
Yet it is precisely the breakneck speed with which Japanese equities tumbled that should give most investors a reason to remain calm.
As a guideline, sudden market selloffs are less dangerous than those that unfold progressively over time. This is because investors who rationally price in bad economic data often do so slowly, as it trickles in. Flash crashes, conversely, are often a sign that some tidbit of bad news made speculative bets go awry, triggering a cascade of trades, many of them automated.
Japan is particularly prone to such reversals because interest rates there are so low that many investors use them to fund higher-yielding investments in other currencies. Whenever markets get jittery, these “carry trades” tend to unravel, pushing up the yen and hitting Japanese stocks, many of which are diversified exporters that do better when global growth accelerates. Amplifying this tendency, Japanese stocks had this year become extremely popular among global investors.
The timing of the rout also points a finger at the Bank of Japan , which last week decided to tighten monetary policy for the first time in 17 years with the explicit goal of boosting the yen. Investors who rushed to cover their bets then triggered the reversal of stretched trades elsewhere, including in the U.S.
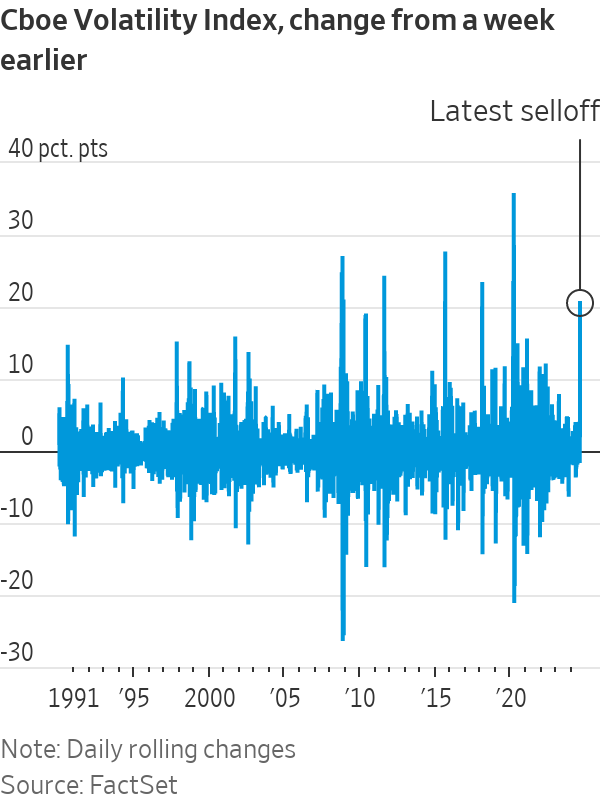
One of the most striking features of the S&P 500 for most of this year has been its extremely low volatility. Until July, the Cboe Volatility Index, or VIX, was at 2019 levels, and kept sliding lower even as investors made big changes to their monetary-policy forecasts.
While the VIX is often dubbed Wall Street’s “fear gauge,” the options contracts it is based on often themselves influence volatility. Whenever investors make bets against market swings, as they have recently in the U.S. by buying lots of structured products , the banks that sell those options are forced to take the other side. These hedges then suppress volatility in the stock market.
The flip side is that whenever a panic breaks through this feedback loop, volatility skyrockets. As the stock market opened Monday, the VIX hovered above 50, making it the highest weekly jump since the onset of the pandemic, though it later fell below 40.
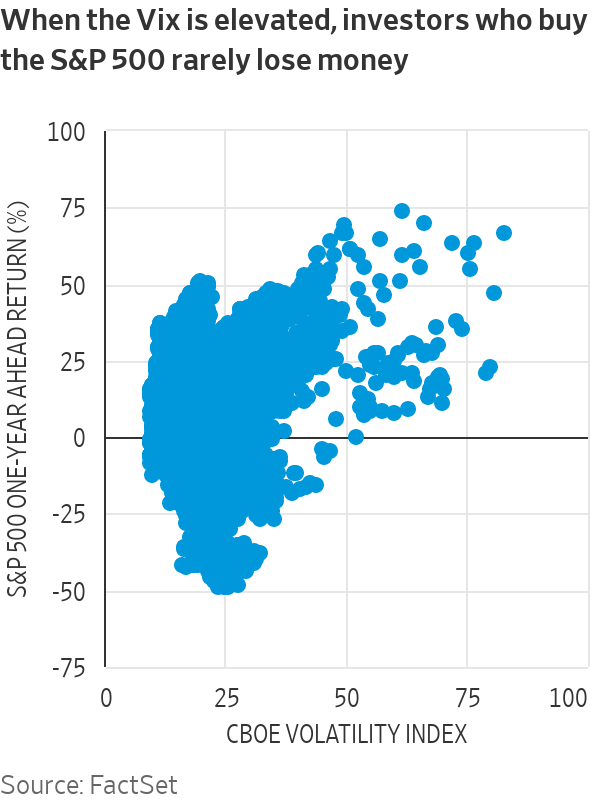
This suggests the selloff is disproportionate, especially looking at the historical record: 87% of the time, investors who bought the S&P 500 on days when the VIX closed at 30 or higher ended up making money a year later.
The second-quarter reporting season has brought mostly good news, with 78% of the S&P 500 firms that have reported so far beating analysts’ earnings estimates—compared with a 74% 10-year average. Both AI-related companies and the rest are reporting net income above what was forecast a month ago. Overall, the U.S. economy still looks robust: The unemployment rate has gone up because the labor force has expanded.
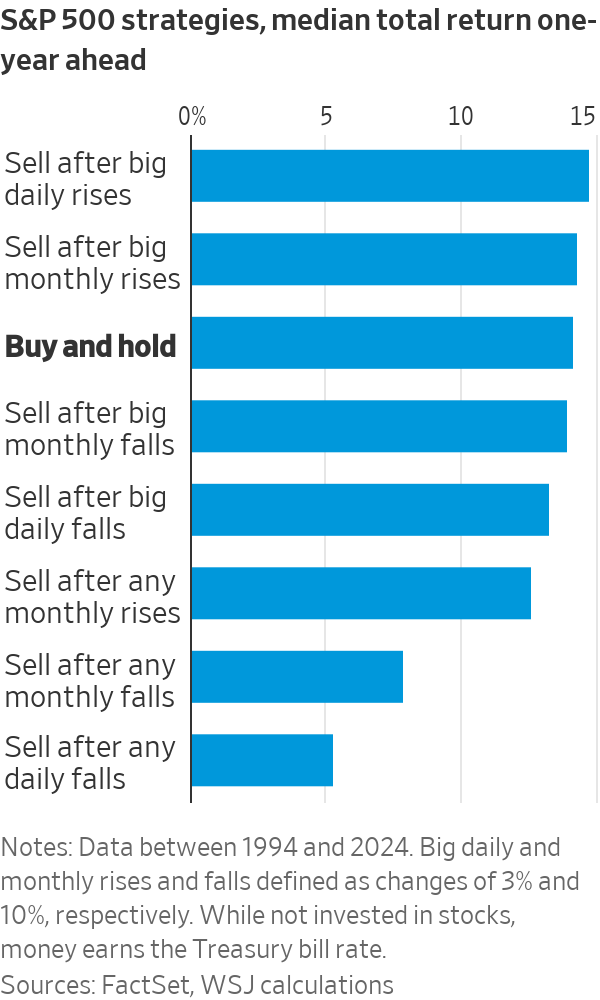
Also, looking at S&P 500 returns since 1994 shows that selling based on the previous day’s falls is a bad strategy. Electing to move into cash after large monthly declines fared better, but still less well than sitting tight.
This isn’t to say that concerns about an economic slowdown or high tech valuations aren’t warranted. Investors have reasons to diversify away from the AI trend or swap more cyclically exposed stocks for more “defensive” names. Indeed, selling out of stocks after particularly exuberant days and months has historically tended to be a winning move. But hindsight is a terrible guide to investing your savings.
 Copyright 2020, Dow Jones & Company, Inc. All Rights Reserved Worldwide. LEARN MORE





From making unpopular decisions to learning when to listen, leaders from five businesses reveal what nobody prepared them for — and how running a company has challenged their expectations.

Technology and semiconductor shares fell sharply as investors questioned the debt financing the AI infrastructure boom and confronted higher rates and Chinese competition.

Technology and semiconductor shares fell sharply as investors questioned the debt financing the AI infrastructure boom and confronted higher rates and Chinese competition.
4 minA sharp technology sell-off has exposed a new anxiety on global markets: whether the enormous borrowing behind the artificial-intelligence infrastructure boom can generate sufficient returns as interest rates rise and Chinese competition intensifies.
The artificial-intelligence investment boom has powered technology shares, semiconductor manufacturers and data-centre operators to extraordinary heights. Last week, investors were given a reminder that much of this expansion is being built with borrowed money.
The technology-heavy Nasdaq Composite fell 4.5 per cent over the week ended October 16, its weakest performance since late June. Semiconductor shares suffered an even deeper correction, with the Philadelphia Semiconductor Index losing about 11.4 per cent.
The selling spread quickly through global markets. Micron Technology fell 14.6 per cent over the week, while South Korea’s Samsung Electronics and SK Hynix dropped approximately 18 per cent and 24 per cent respectively.
This was more than a routine bout of profit-taking. Investors were reassessing three interconnected risks: higher interest rates, the rapidly expanding debt burden attached to AI infrastructure and the prospect of stronger competition from Chinese memory-chip manufacturers.
The debt behind the AI build-out
Artificial intelligence requires a physical infrastructure network of enormous scale. Data centres must be built, advanced processors purchased, power supplies secured and cooling systems installed before customers begin generating meaningful revenue from them.
Technology companies are increasingly supplementing their own cash with corporate bonds, syndicated loans, equipment leases, private credit and project-level financing.
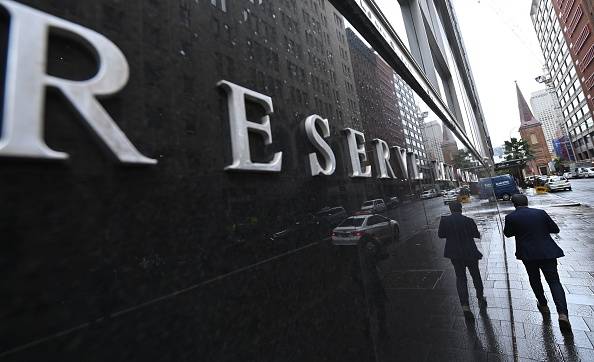
JPMorgan describes the emerging funding model as a combination of conventional corporate borrowing and project finance tied to individual data-centre assets. In Australia, the Reserve Bank estimates that syndicated loans accounted for approximately three-quarters of data-centre financing during 2025 and 2026 to date.
The numbers are becoming large enough to affect broader credit markets. The Federal Reserve Bank of Dallas has cited Wall Street estimates suggesting AI-related investment-grade bond issuance could approach US$300 billion in 2026 alone.
That borrowing is not automatically problematic. Debt can be an efficient way to finance long-lived infrastructure when future revenue is sufficiently predictable. The concern is that AI technology, customer demand and computing economics are changing much faster than the repayment schedules attached to the assets.
A data centre financed today may carry debt for years. Investors must therefore make assumptions about future utilisation rates, electricity prices, chip performance, customer concentration and the amount businesses will ultimately pay for AI computing.
When interest rates rise, those assumptions become less forgiving.
Inflation changes the calculation
September’s US inflation data intensified the pressure. Consumer prices increased 3.7 per cent over the year, ahead of market expectations and up from 3.4 per cent in August.
The hotter reading reduced confidence that interest rates would fall quickly and pushed bond yields higher. That matters particularly for companies whose valuations depend on profits expected well into the future, as well as highly leveraged infrastructure operators that may need to refinance.
CoreWeave has emerged as a closely watched test case. The specialist cloud-computing company has accumulated substantial debt and lease obligations to build AI capacity, while relying on a concentrated group of large technology customers.
Its shares fell sharply during the sell-off, while the cost of insuring its debt against default climbed. CoreWeave has argued that its contracted backlog more than covers its obligations and that financial markets do not always understand its business model. Nevertheless, its securities have become a proxy for investor confidence in debt-funded AI infrastructure.
Oracle, another major investor in AI computing capacity, fell 8.8 per cent in Friday trading, while CoreWeave dropped 15.5 per cent.
The question is shifting from how much AI infrastructure can be built to how profitably it can be operated.
China adds another source of pressure
Interest rates were not the only catalyst. Reports of advances by Chinese memory-chip producer ChangXin Memory Technologies raised concerns that lower-cost Chinese products could increase competition across the global semiconductor industry.
Memory chips are essential to AI systems, but the industry is historically cyclical. Periods of tight supply and high pricing can encourage rapid investment, eventually producing oversupply and falling margins.
The prospect of a well-funded Chinese competitor expanding its technological capabilities unsettled investors in Samsung, SK Hynix and Micron. It also demonstrated that AI-related demand does not insulate chipmakers from conventional competitive pressures.
That combination—slower rate cuts, more expensive financing and potentially cheaper supply—challenged the assumption that every company exposed to AI would enjoy continually expanding margins.
A reset rather than the end of the boom
The sell-off does not establish that the AI boom is ending. Demand for computing power remains strong, the largest technology companies continue to generate formidable cash flows and many infrastructure projects are backed by long-term customer contracts.
What has changed is the market’s willingness to overlook the price and financing structure of that growth.
The most resilient companies are likely to be those able to fund investment from operating cash flow, secure long-duration customers and demonstrate that new capacity will earn returns comfortably above its financing costs.
More speculative operators may face greater scrutiny, particularly where debt is expensive, customers are concentrated or expected revenue depends on demand that has not yet materialised.
For Australian investors, the lesson extends beyond US technology shares. Local data-centre operators, infrastructure funds, electricity suppliers and property groups are increasingly exposed to the same investment cycle.
Artificial intelligence may remain one of the defining growth themes of the decade. But last week’s correction showed that enthusiasm for the technology does not eliminate financial discipline.
The next stage of the AI boom will be judged not only by computing power, model performance or demand for chips, but by something more traditional: whether the assets being financed can generate enough cash to repay the money borrowed to build them.
Fact box
Nasdaq Composite: Down 4.5 per cent for the week ended October 16, 2026
Philadelphia Semiconductor Index: Down approximately 11.4 per cent
Micron Technology: Down approximately 14.6 per cent
Samsung Electronics: Down approximately 18 per cent
SK Hynix: Down approximately 24 per cent
US September inflation: 3.7 per cent annually
Estimated 2026 AI-related investment-grade issuance: Approximately US$300 billion

Four decks, 34.5 metres and a made-to-measure interior: step aboard the new Custom Line Navetta 35, unveiled at Cannes.

Automobili Lamborghini and Babolat have expanded their collaboration with five new colourways for the ultra-exclusive BL.001 racket, limited to just 50 pieces worldwide.