Airlines Need to Boost Revenue. They’re Coming for Your Bags.

 2 min
2 min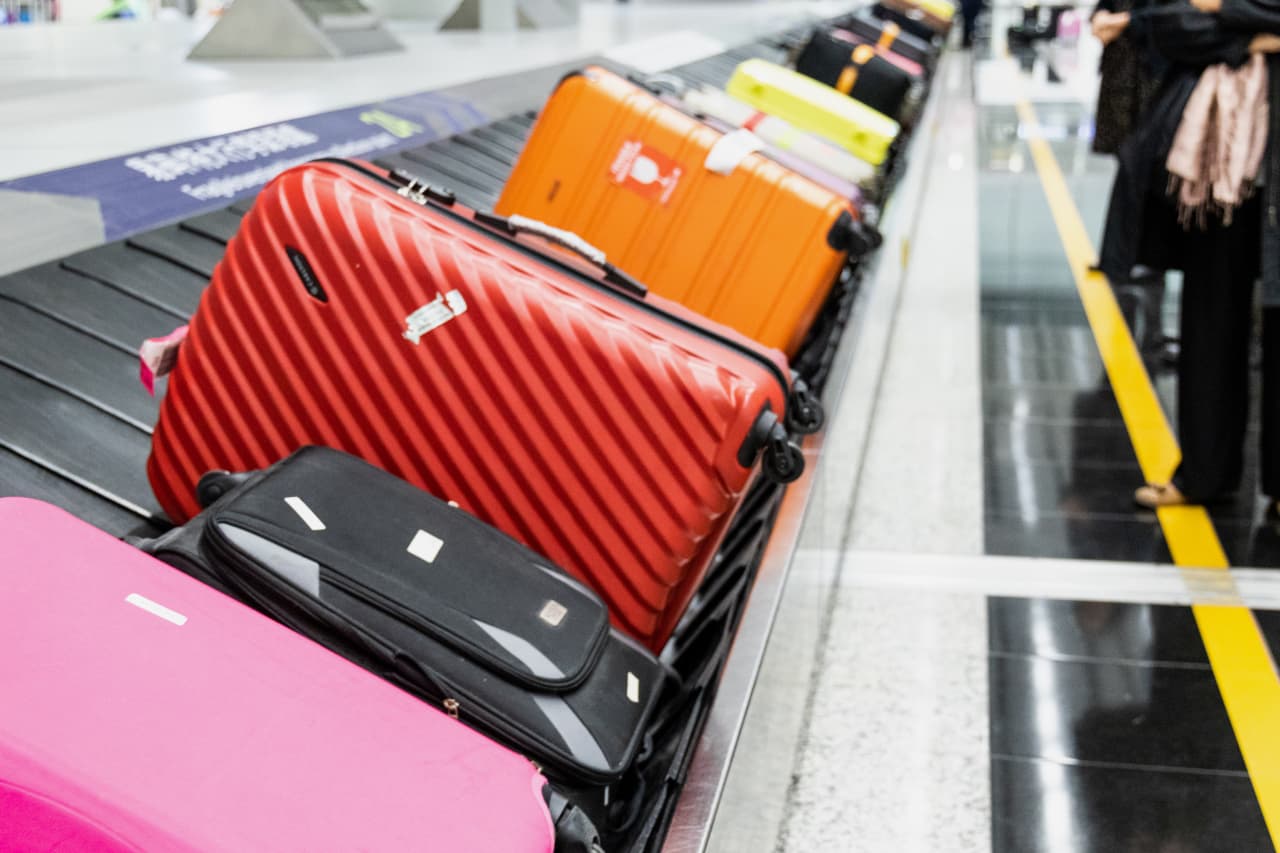
Airlines facing tough financial comparisons after a bumper year have a plan to boost revenue that fliers will hate. They’re raising the price of checking your bag.
Delta Air Lines , the latest company to announce a price hike, announced last week it was increasing the cost of a passenger’s first checked bag to $35 from $30 and a second bag to $45 from $40. The company last increased checked baggage fees in 2018. American Airlines and United Airlines made similar changes, raising baggage fees by about $5, and JetBlue Airways and Alaska Airlines have also raised prices.
Airline companies are dealing with a double whammy. Higher labour costs and an uptick in maintenance costs are eating into revenue. Meanwhile, domestic demand has softened , hitting pricing power for airlines.
Fees are a significant and growing source of revenue for airlines. U.S. airlines generated $6.8 billion from bag fees in 2022, according to the Bureau of Transportation Statistics , up from $5.3 billion in 2021. American Airlines generated $1.4 billion from baggage fees that year, which accounts for less than 3% of its 2022 revenue. United made $1.1 billion, or 2.6% of its 2022 revenue; Delta pocketed $980 million, or 2.1% of its 2022 revenue.
It’s likely those figures grew in 2023, a record-breaking year for travel with six of the 10 busiest days in U.S. aviation history, according to the Transportation Security Administration. With airlines hiking prices on the first checked bag by an average of 17%, that number could rise again this year.
That should help offset the decline in airfare. Ticket prices were 6% lower in January compared with the year-ago period, according to January’s consumer price index data. Online travel agency Hopper expects domestic fares to remain below 2023 and pre pandemic levels for at least the first half of the year.
Hopper’s lead economist Hayley Berg said more planes in the air have helped bring prices down. “Price relief on domestic airfare comes as domestic seat capacity has maintained at least a 5% lift over 2019 levels throughout 2023,” she said.
Ultimately, baggage fees account for between 2% and 3% of revenue for the largest U.S. airlines. But the market will be judging United, American, and Delta against a strong 2023, so every little helps. All three stocks have risen between 7% and 10% in 2024. And there are other more important factors, such as costs, demand, and capacity constraints, that will have a larger impact on earnings.
Of course, earnings aren’t the first thing on the minds of travellers who are now getting hit with higher fees.
 Copyright 2020, Dow Jones & Company, Inc. All Rights Reserved Worldwide. LEARN MORE




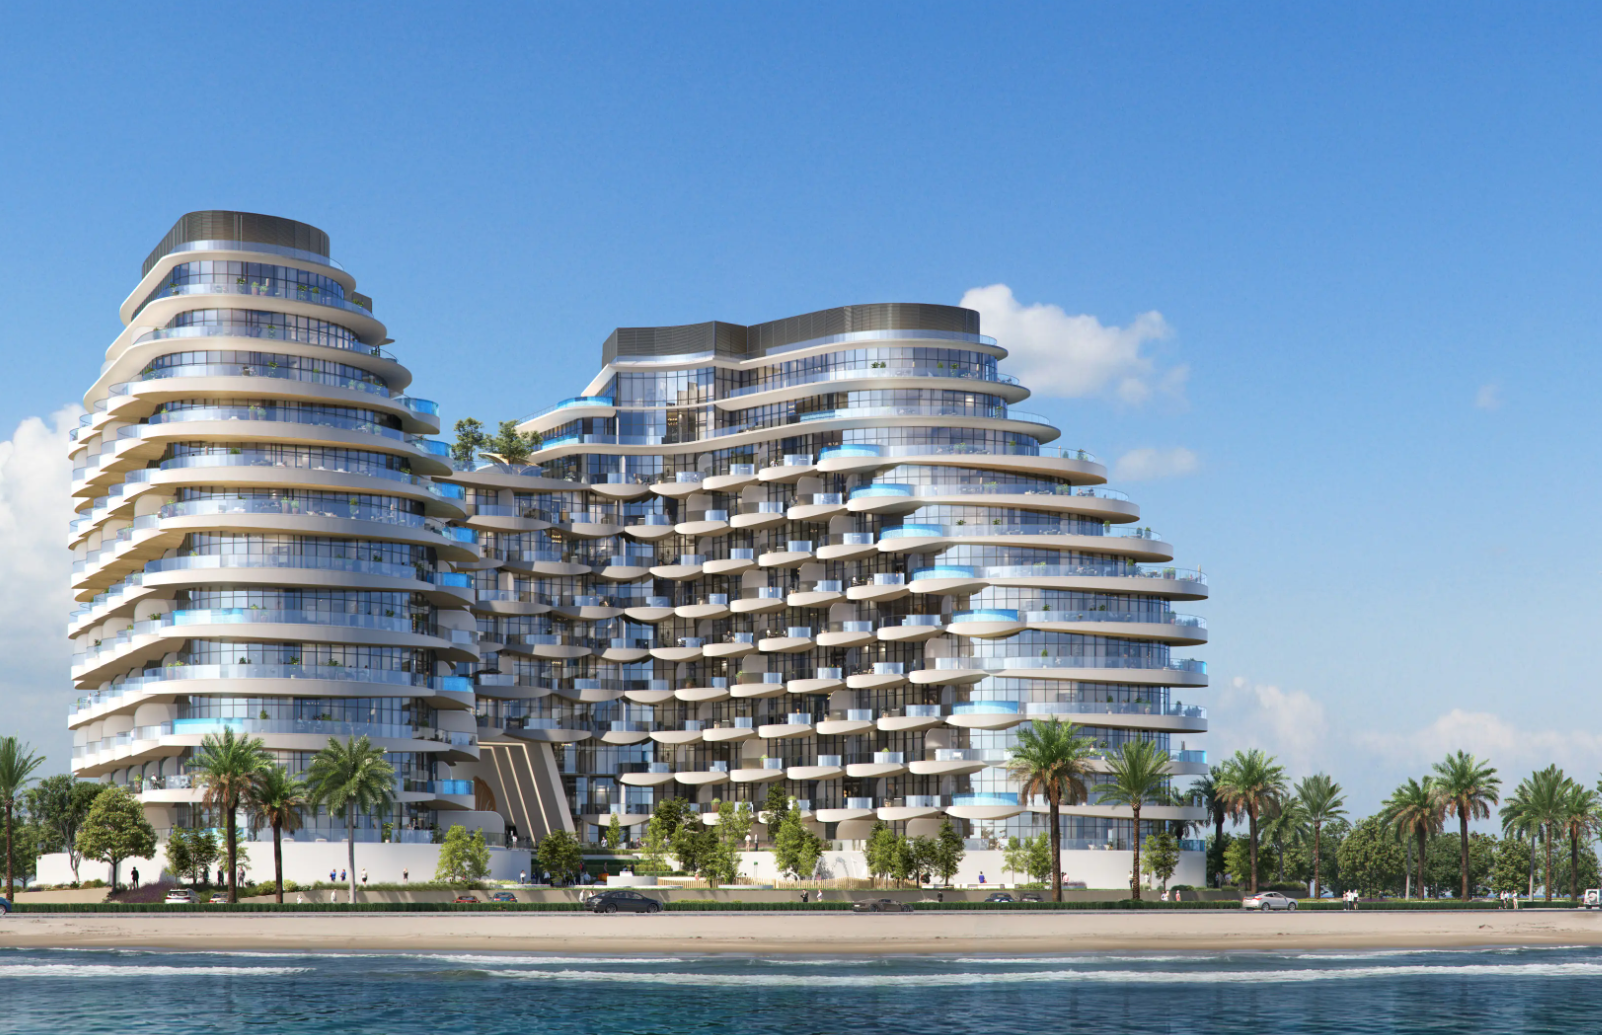
BNW Developments has established a Sydney presence, joining Arada and Sobha Realty among the growing number of UAE developers pursuing Australian buyers and development opportunities.

Australian shares fell on Thursday as Wall Street weakness, rising oil and persistent rate concerns weighed on most of the market. The S&P/ASX 200 declined 0.72 per cent to 8,702. The All Ordinaries lost 0.66 per cent to finish at 8,897. Mining stocks were hit particularly hard, while real estate also dragged on the index. …
Continue reading “ASX falls 0.7 per cent as miners and property stocks retreat”
 2 min
2 minAustralian shares fell on Thursday as Wall Street weakness, rising oil and persistent rate concerns weighed on most of the market.
The S&P/ASX 200 declined 0.72 per cent to 8,702. The All Ordinaries lost 0.66 per cent to finish at 8,897. Mining stocks were hit particularly hard, while real estate also dragged on the index.
Energy was the notable exception, gaining more than one per cent as Brent crude traded above US$103 a barrel. Oil had moved higher amid uncertainty surrounding potential US diesel-export restrictions and broader geopolitical supply risks. The move supported energy producers but renewed concern about inflation inputs across transport and the wider economy.
Gold shares were weak even as spot bullion remained historically elevated. The All Ordinaries Gold index fell about 2.25 per cent, showing that equity performance can diverge from the commodity because of valuation, currency, operating and company-specific factors.
Zip was a prominent loser, falling 11.38 per cent after the company reported short sales after the previous close. Nine Entertainment also weakened after UBS analysts warned of near-term revenue challenges associated with its advertising-supported subscription tier.
Premier Investments led larger winners despite caution about the retail environment. Breville, in which Premier owns a significant stake, also appeared among leading movers. In the broader ASX 300 screen, Myer gained 11.43 per cent and MAAS Group rose 7.93 per cent, while Lotus Resources fell 10.53 per cent. These percentage moves should be checked against company announcements and trading liquidity before attributing causes.
The Australian dollar was broadly flat at US70.38 cents. Spot gold was around US$4,280 an ounce, Brent crude approximately US$103.08 a barrel and iron ore near US$96.90 a tonne late in the session.
The rate outlook remains the central domestic catalyst. Labour-market weakness has not eliminated the possibility of an RBA increase next week, leaving banks, listed property and other rate-sensitive sectors exposed to changing expectations.
Market dashboard
S&P/ASX 200: 8,702, down 0.72 per cent.
All Ordinaries: 8,897, down 0.66 per cent.
Best sector: Energy, up more than one per cent.
Weakest areas: Real estate and materials were the major drags; confirm final sector percentages before publication.
Material winner: Premier Investments led the large-company gainers. Confirm its final closing move from the ASX before publication.
Material loser: Zip, down 11.38 per cent.
ASX 300 percentage leader: Myer, up 11.43 per cent.
ASX 300 percentage laggard: Zip, down 11.38 per cent.
AUD/USD: Approximately US$0.7038, broadly flat.

ABC Bullion has launched a pioneering investment product that allows Australians to draw regular cashflow from their precious metal holdings.
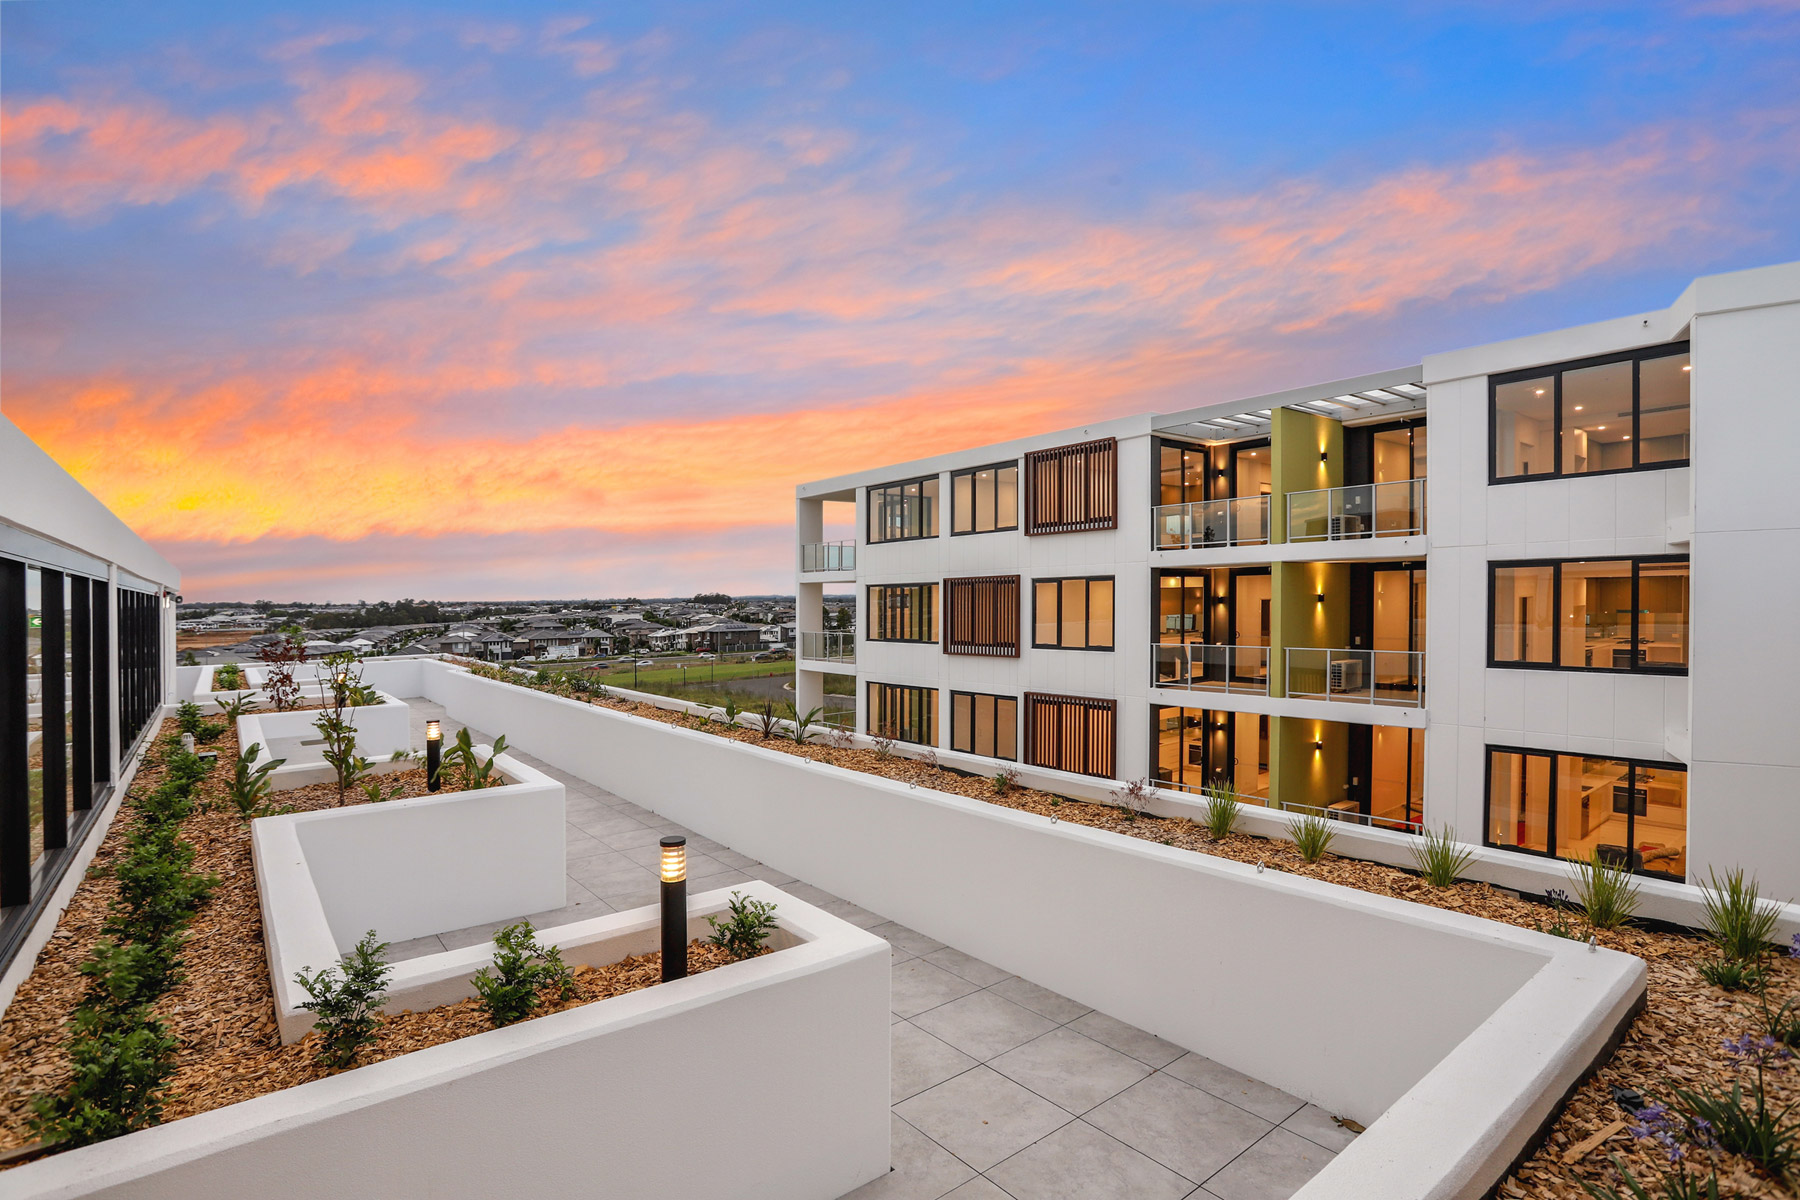
Ophora Tallawong has launched its final release of quality apartments priced under $700,000.