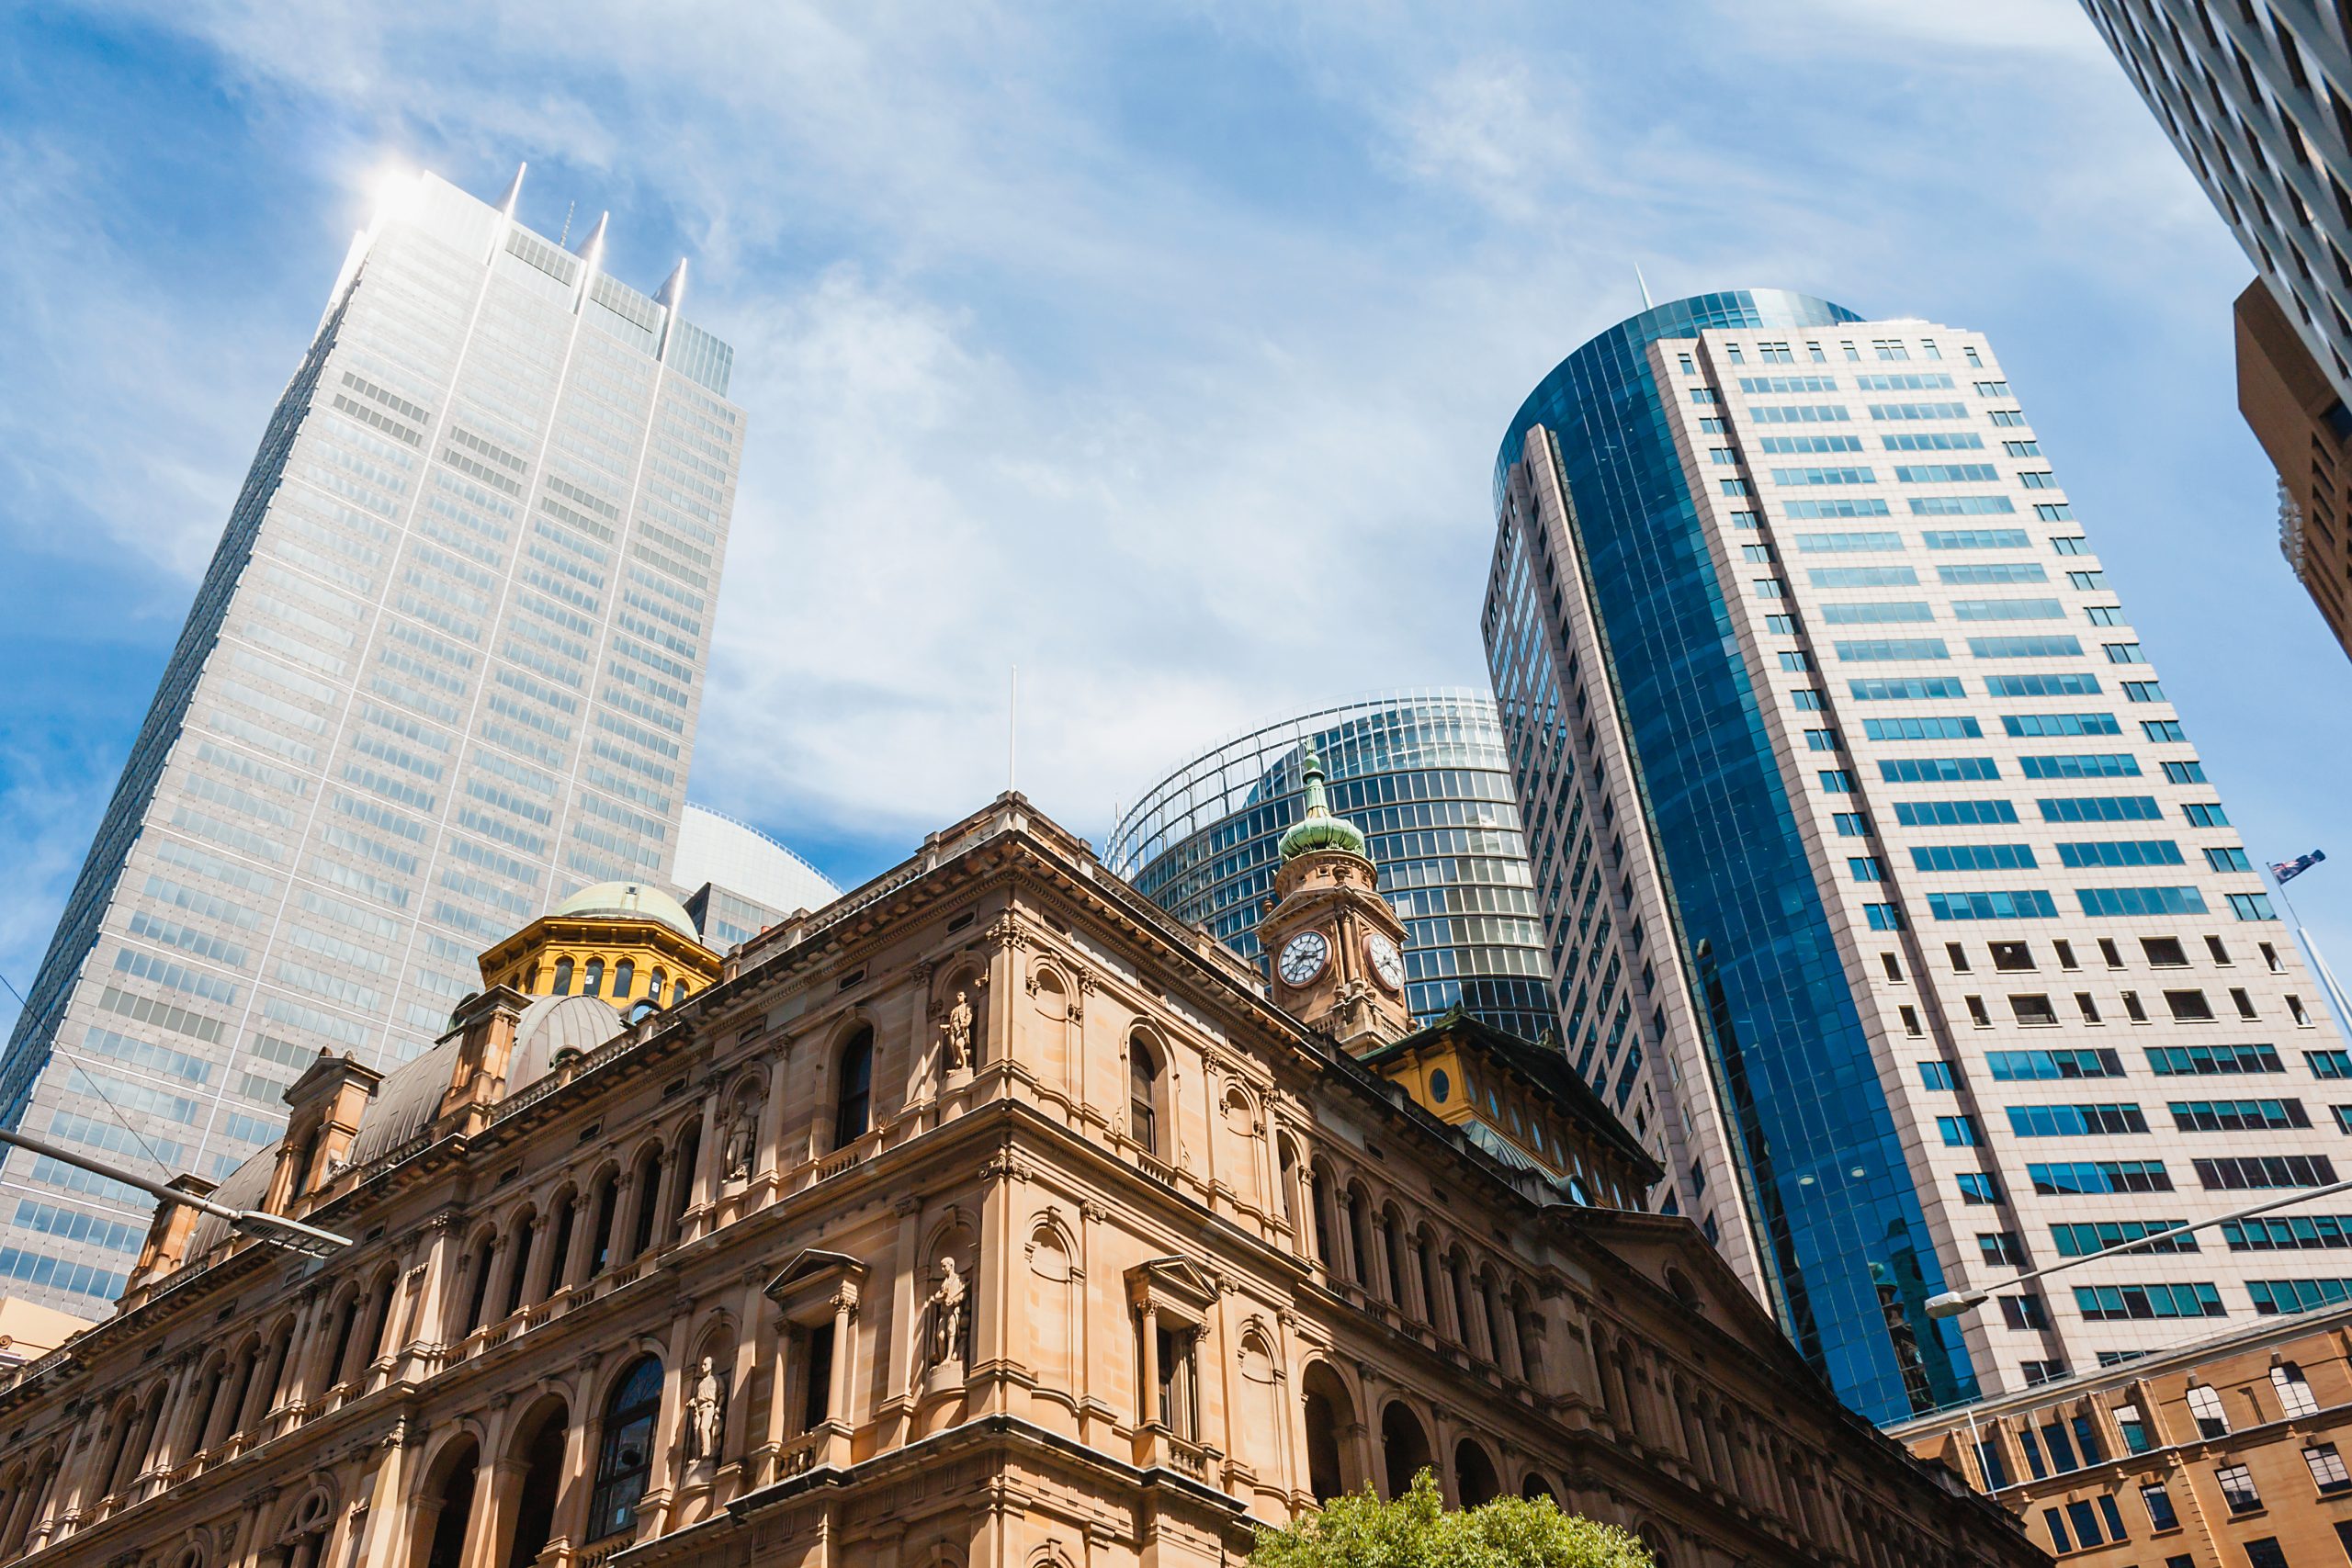
HOW TO MINIMISE THE BIGGEST RISKS IN COMMERCIAL PROPERTY INVESTING
Commercial property can deliver strong returns, but the risks are real. Here’s how to spot the danger zones and protect your investment.
 2 min
2 min
Commercial property can deliver higher yields, longer leases, and more passive income than residential. But with greater returns come greater risks. The rules are different, the stakes are higher, and one misstep can turn a promising asset into a financial burden.
Here, property expert Abdullah Nouh outlines five of the biggest risks in commercial investing and how to manage them strategically.
1. Vacancy risk
Vacancies in commercial property cut deeper than in residential. An empty building means no rent, yet you’re still footing the bill for rates, insurance and maintenance.
This is especially dangerous in oversupplied markets. In major CBDs like Melbourne and Sydney, office vacancy rates have climbed as high as 30 per cent. In such environments, landlords often need to offer high-end fit-outs or generous incentives to attract tenants.
How to minimise it: Invest in tightly held, high-demand locations. Choose properties with secure, long-term leases and flexible layouts that can suit multiple industries if a tenant moves out.
2. Weak lease structures
Not all leases offer equal protection. Some may appear strong – long-term, high rent, decent yield – but lack real security for the landlord. Some tenants can exit with minimal penalty. Others sign inflated leases that look good on sale but collapse at renewal.
How to minimise it: Scrutinise lease terms. Know how rent increases are structured, whether there are break clauses, and whether the rent reflects market conditions. Favour leases with guarantees, security deposits, or cash bonds – and always vet the financial health of the tenant.
3. Overpaying
A high yield doesn’t always mean a good deal. A 7.5 per cent return from a regional tenant in a shaky industry may be far riskier than a 5.5 per cent return from a stable, ASX-listed tenant in a prime location. Chasing numbers without context exposes you to tenant defaults, falling rents, or limited resale options.
How to minimise it: Focus on tenant quality and lease sustainability, not just the headline yield. Understand the tenant’s industry and how it might weather an economic downturn. Always base your valuation on true market rent – not inflated or unsustainable figures.
4, Market volatility
Commercial sectors respond differently to economic shifts. Retail has been hit by e-commerce, while office spaces face challenges from hybrid working. Yet some sectors – logistics, healthcare, childcare – have proven resilient.
How to minimise it: Target essential services less vulnerable to economic cycles. Stay across industry trends and adjust your portfolio as needed. Diversify across sectors and regions to spread risk.
5. Finance and liquidity
Commercial finance is trickier than residential. It requires larger deposits, stricter checks, and often hinges on lease strength, not your personal income. Selling can also be slower – especially if your tenant is weak or the lease is short.
How to minimise it: Use brokers who understand lease-doc lending, where loans are based on rental income. Buy properties with strong leases in prime locations to ensure broader buyer appeal. Always plan your exit strategy and maintain cash buffers to manage tenant turnover or delayed sales.
Commercial property isn’t for everyone – but for those who know the risks and manage them well, it can be a powerful tool for building wealth. Smart investors don’t just buy for today. They plan for what could go wrong and structure their deals to survive it.
Abdullah Nouh is the founder of Mecca Property Group, a boutique buyer’s agency in Melbourne, helping Australians build wealth through strategic property investment.

Waldorf Astoria Kuala Lumpur is scheduled to open on 30 October, introducing the Hilton luxury brand to Malaysia with an all-suite hotel in the city’s Golden Triangle.
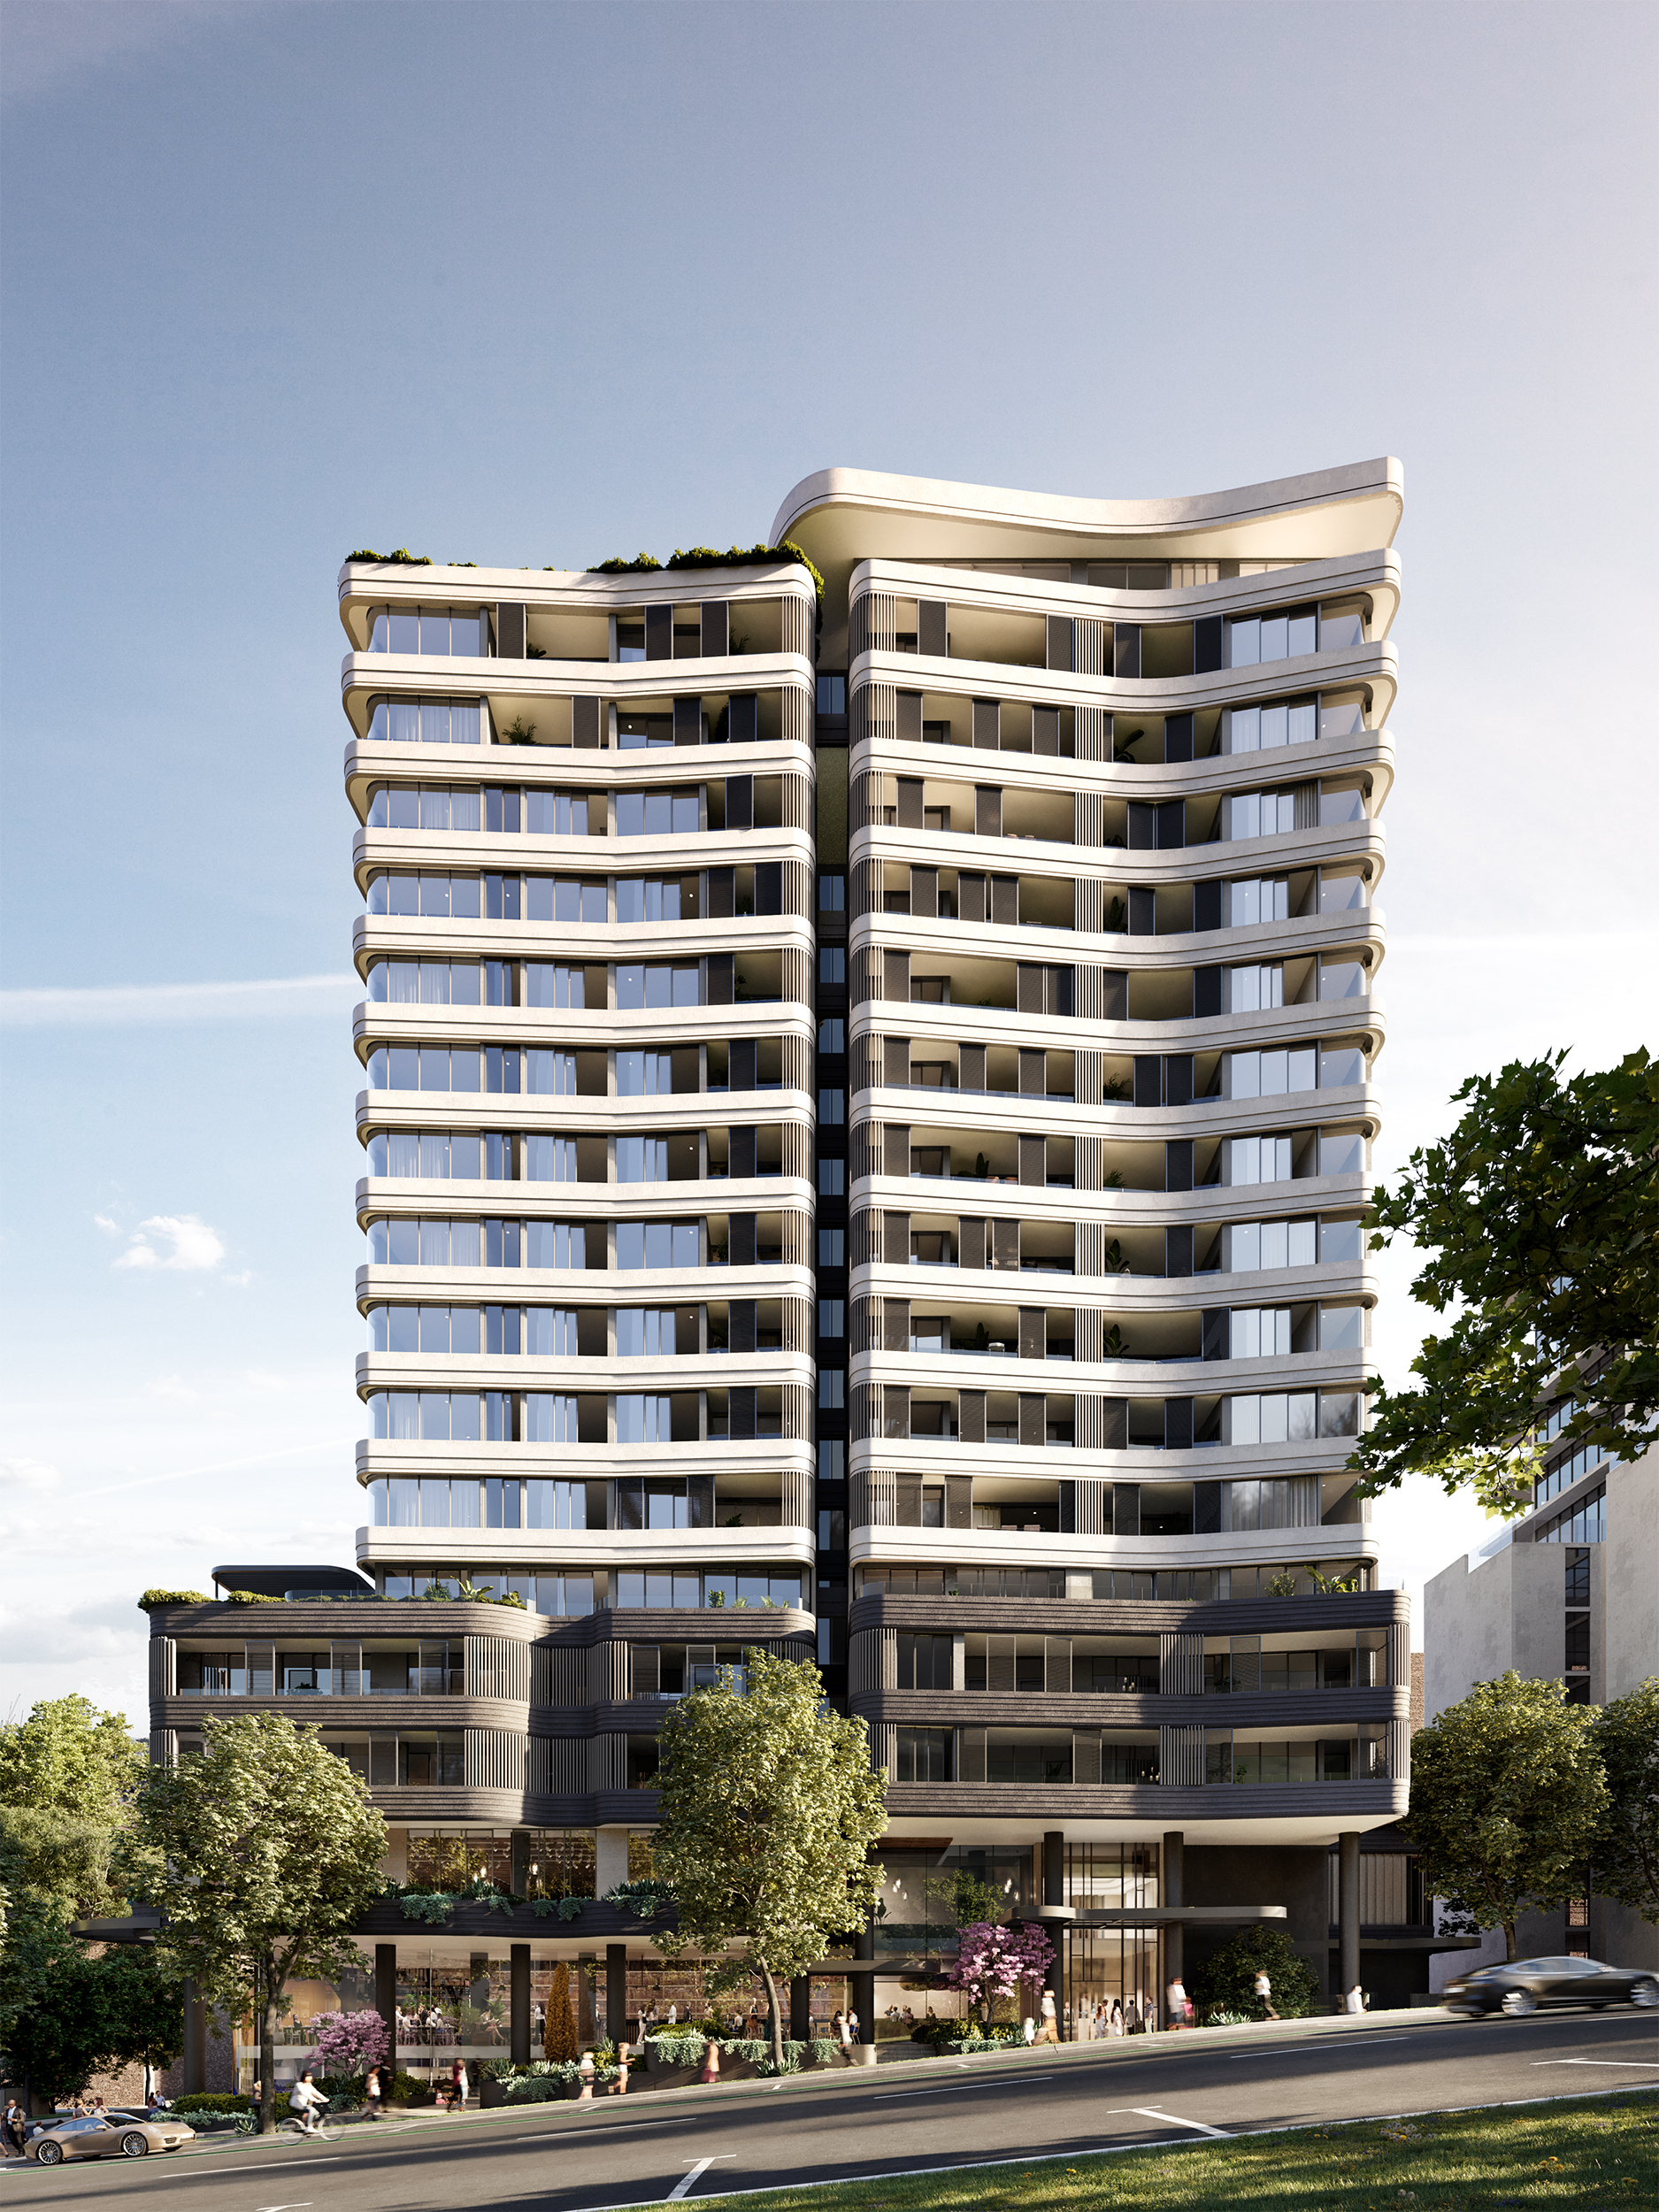
Located steps from Crows Nest Metro, the near-complete development brings luxury living to Sydney’s Lower North Shore.
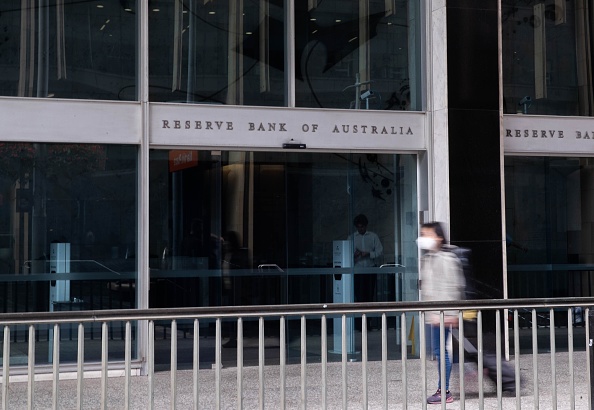

Employment fell by 39,300 and unemployment held at a revised 4.7 per cent, giving the RBA more room to pause in November.
2 min
Australia’s labour market weakened in September, reducing—but not eliminating—the case for another Reserve Bank rate rise in November.
The seasonally adjusted unemployment rate was 4.7 per cent, according to the Australian Bureau of Statistics. August was revised to the same level, while September employment fell by 39,300 people. The number of unemployed Australians increased by 8,900 to 732,000.
The weakness extended beyond the headline rate. The employment-to-population ratio fell 0.3 percentage points to 63.6 per cent, participation declined 0.2 points to 66.8 per cent and underemployment edged up to 6.3 per cent. Part-time employment fell by 73,700, partly offset by a 34,400 increase in full-time work.
For the RBA, this is a clearer sign that restrictive monetary policy is cooling demand. Higher unemployment and falling employment reduce wage pressure over time and increase the risk that another rate rise would push the economy harder than necessary.
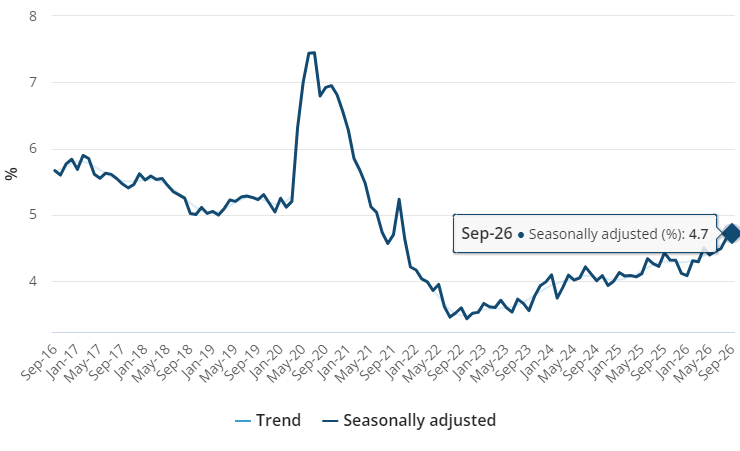
That makes a November increase less certain. It does not make a hold inevitable. The RBA must balance labour-market softness against inflation, and the September-quarter consumer price index due later in October will carry more direct weight in the decision.
For mortgage holders and property investors, the practical conclusion is not to trade one data release. Borrowers should continue testing repayments at higher rates, preserve liquidity and avoid basing a purchase on an assumed near-term reversal. Refinancing decisions should be assessed against total cost, not simply the advertised rate.
Property markets may initially welcome a reduced probability of another increase because borrowing capacity and sentiment are highly rate-sensitive. But a weakening labour market is not unambiguously positive for housing: job security supports mortgage serviceability, rental demand and buyer confidence.
The September numbers have given the RBA a credible reason to wait. Inflation will determine whether it can use it.

From office parties to NYE fireworks, here are the bottles that deserve pride of place in the ice bucket this season.

Advertising legend John Singleton unveils an exclusive 16-residence Caroline Bay development, marking his latest high-end property play on the Central Coast.