


The Sunshine State Is In High Demand
Queensland’s residential property market experiences strong quarter.
 < 1 min
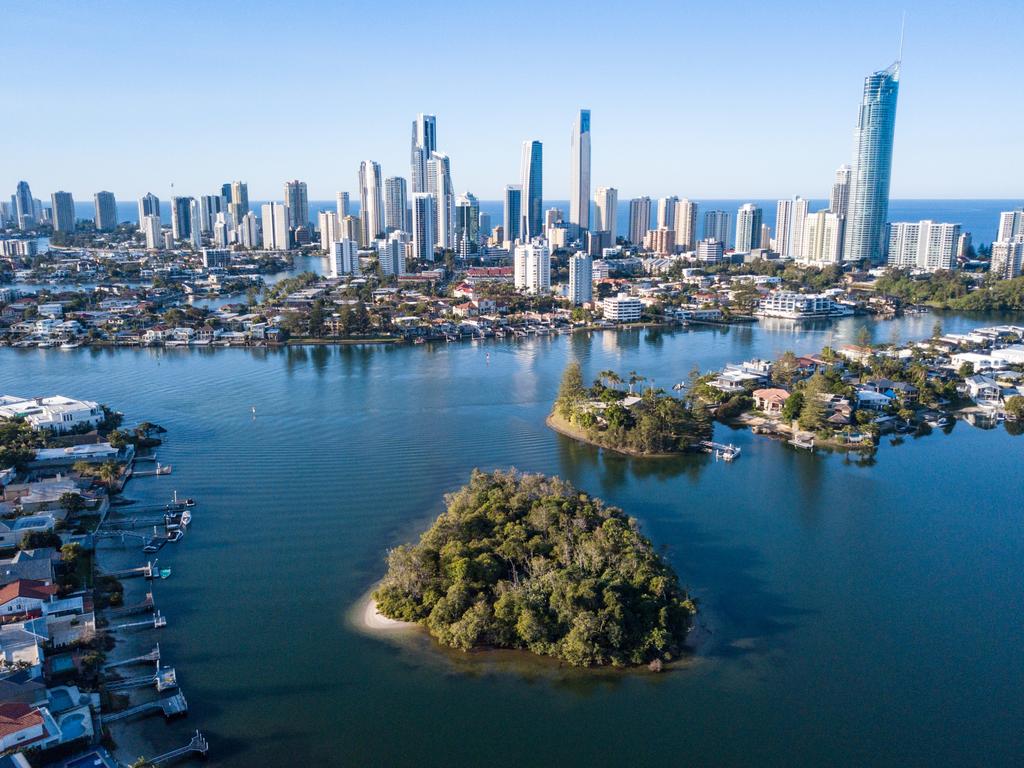
Across Queensland, median house prices climbed 1.8% over the quarter with Greater Brisbane and tourism hotspots proving the most appealing.
Brisbane achieved the highest number of house sales over the quarter according to data from the Real Estate Institute of Queensland (REIQ), with 3912 sales. This was followed by the Gold Coast (2,419), Moreton Bay (1,945), Sunshine Coast SD (1,510), Logan (1,413) and Ipswich (1,366).
Brisbane’s median house price rose by 4.7% over the quarter, reaching a new high of $900,000. The new figures represent a 15.5% growth compared to 12 months prior.
Despite the rise, Greater Brisbane still remains affordable with the capital city outskirts experiencing a lesser 2.8% quarterly increase to a median house price of $640,000.
Noosa was the clear stand-out with 13% growth in the quarter. However, the holiday-town couldn’t match its previous efforts of 19.8% growth in the June 2021 quarter.
Ipswich (8.7%), Redland and Fraser Coast (both at 6.5%), and Bundaberg (6.4%) followed on to round out the top five fastest-growing local government areas.
Noosa also took the top spot for the highest quarterly median sale price at $1.3 million — $400,000 above the state’s next best performer Brisbane at $900,000, Sunshine Coast SD at 850,000, Sunshine Coast at $825,000 and Gold Coast at $810,500.
It’s not only houses on the rise as Queensland’s median unit prices rose 3.5% over the quarter.
Local government areas such as Mackay (17.4%), Sunshine Coast 12.1%) and Sunshine Coast SD (11.1%) all saw double-digit growth in the quarter.
Greater Brisbane experienced moderate median unit price growth at 1.8 per cent to reach $420,000.
Coastal areas garnered the highest unit prices with Noosa ($850,000), Sunshine Coast SD ($600,000), Sunshine Coast ($560,000) and Gold Coast ($510,000) at the top of the charts.

This stylish family home combines a classic palette and finishes with a flexible floorplan

Just 55 minutes from Sydney, make this your creative getaway located in the majestic Hawkesbury region.

A Sydney site with a questionable past is reborn as a luxe residential environment ideal for indulging in dining out
2 min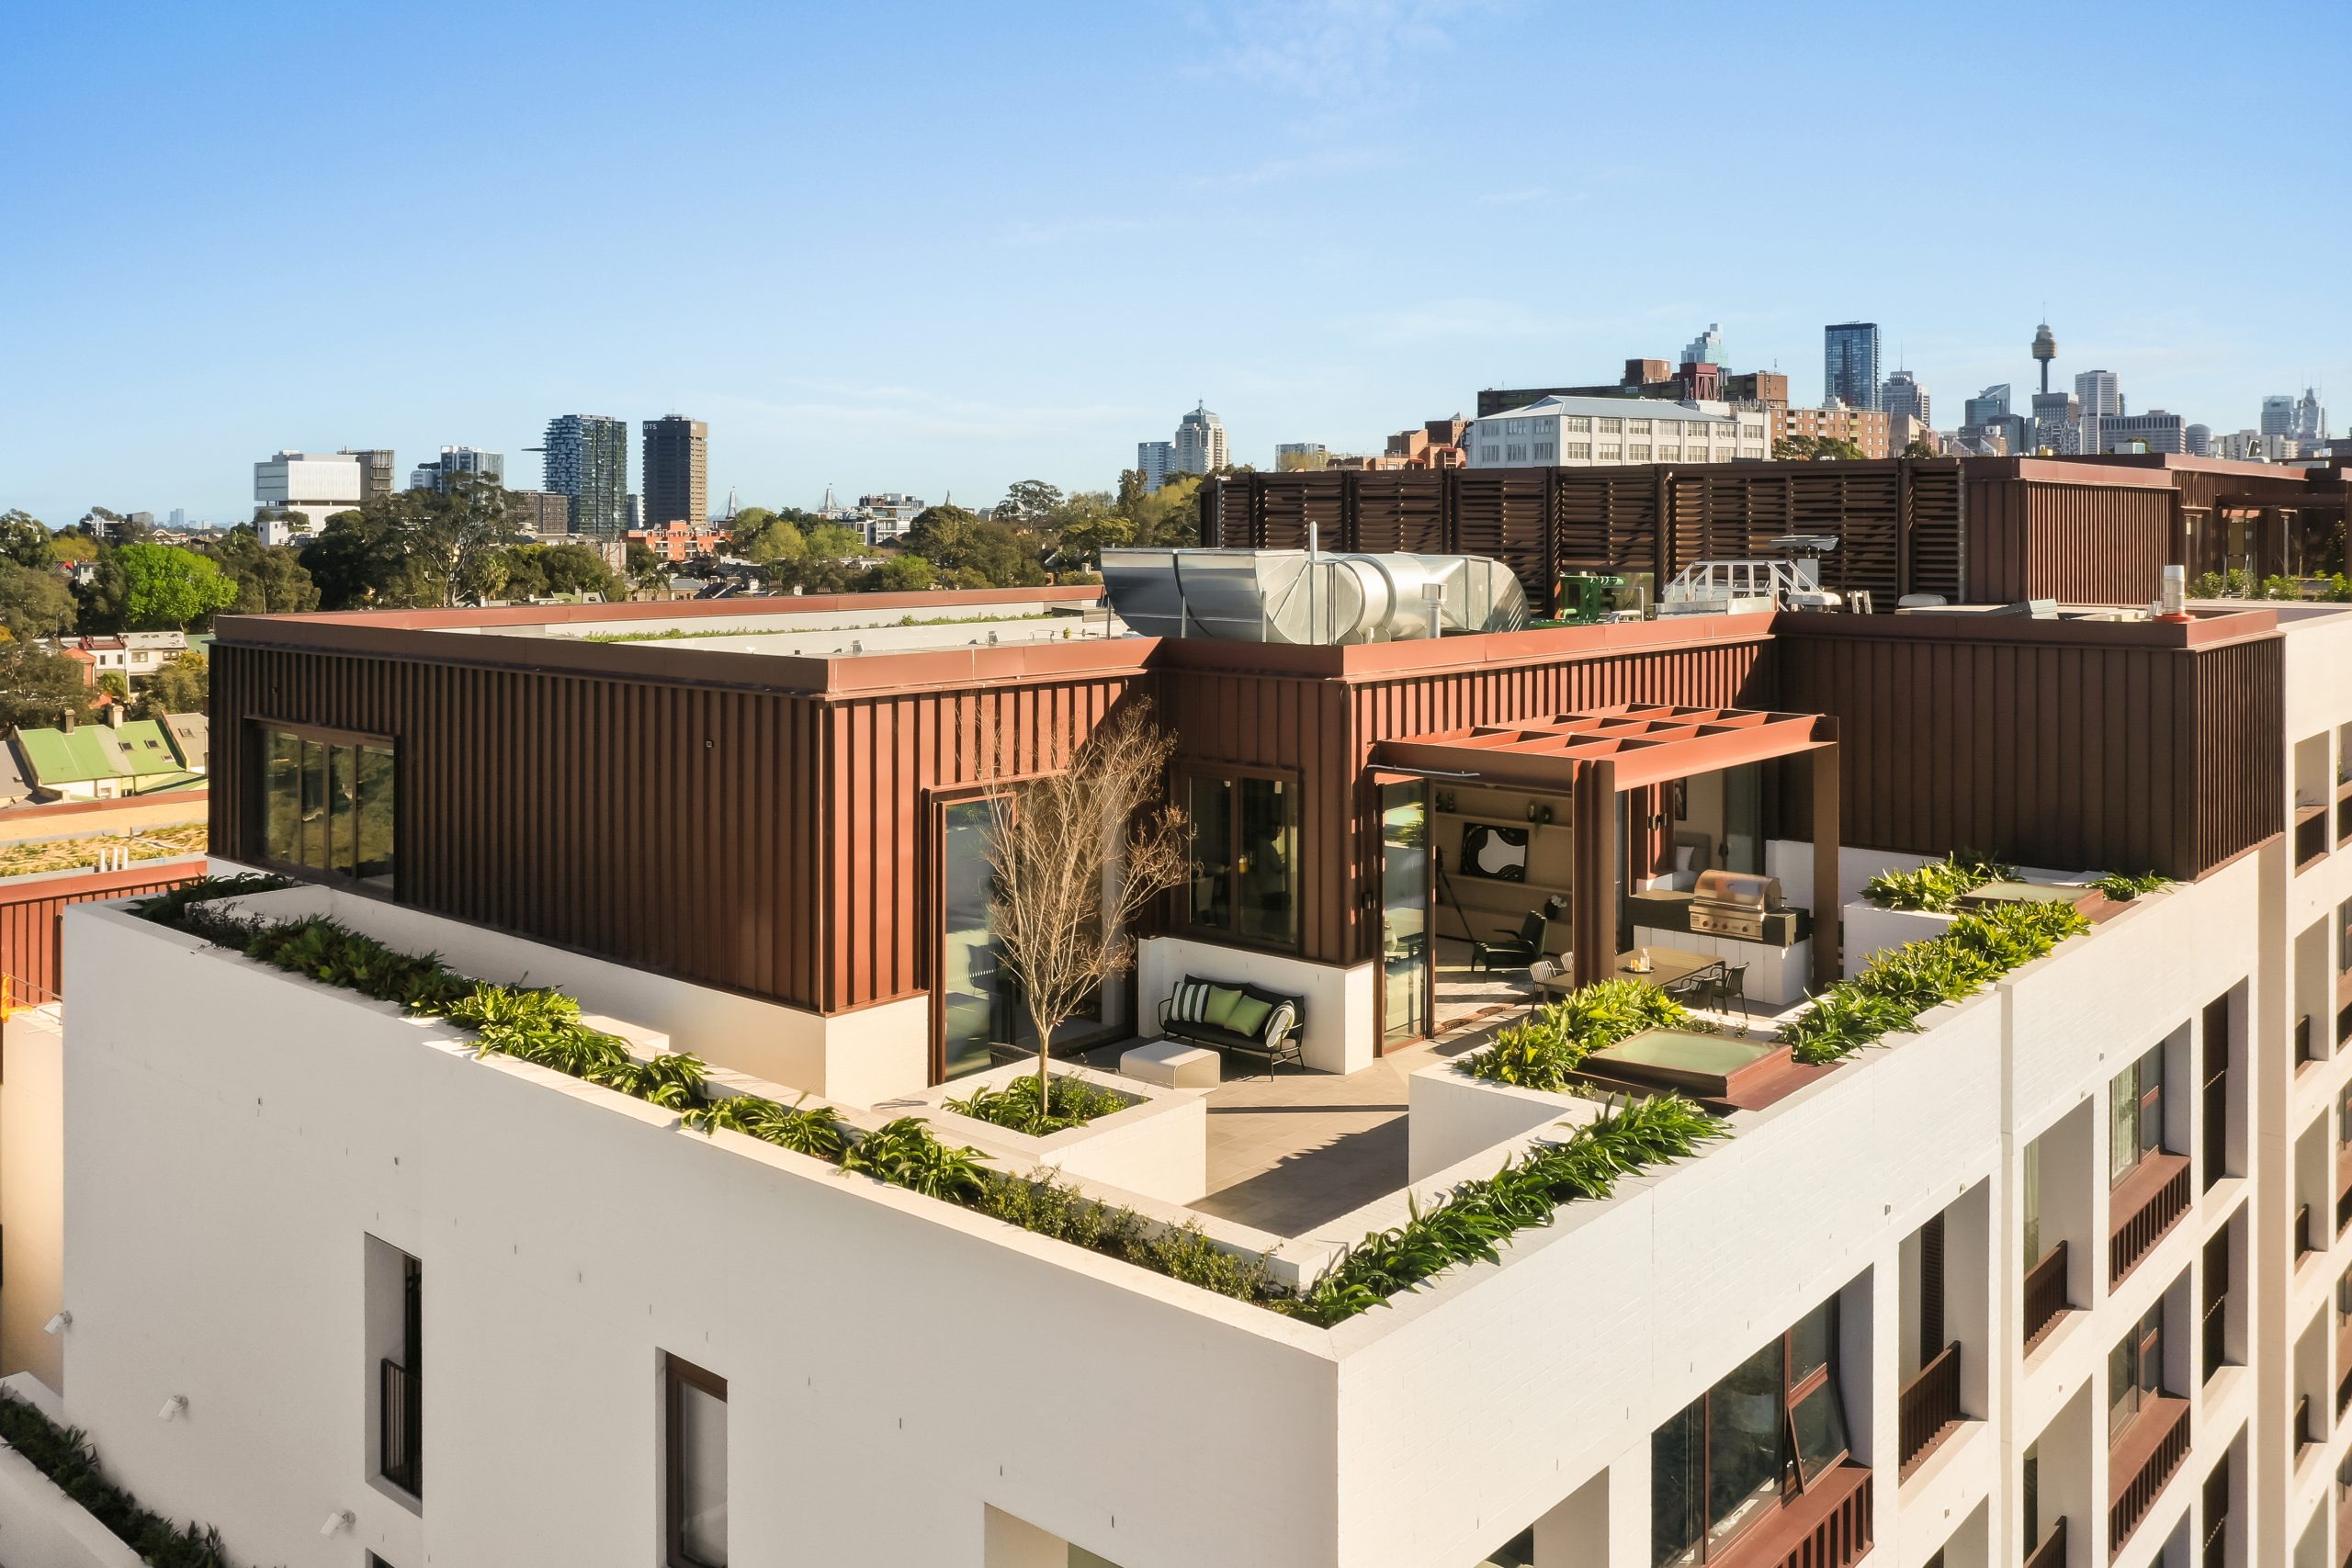
Long-term Sydney residents always had handful of not-so-glamourous nicknames for the building on the corner of Cleveland and Baptist Streets straddling Redfern and Surry Hills, but after a modern rebirth that’s all changed.
Once known as “Murder Mall” or “Methadone Mall”, the 1960s-built Surry Hills Shopping Centre was a magnet for colourful characters and questionable behaviour. Today, however, a $500 million facelift of the site — alongside a slow and steady gentrification of the two neighbouring suburbs — the prime corner property has been transformed into a luxury apartment complex Surry Hills Village by developer Toga Group.
The crowning feature of the 122-apartment project is the three-bedroom penthouse, fully completed and just released to market with a $7.5 million price guide.
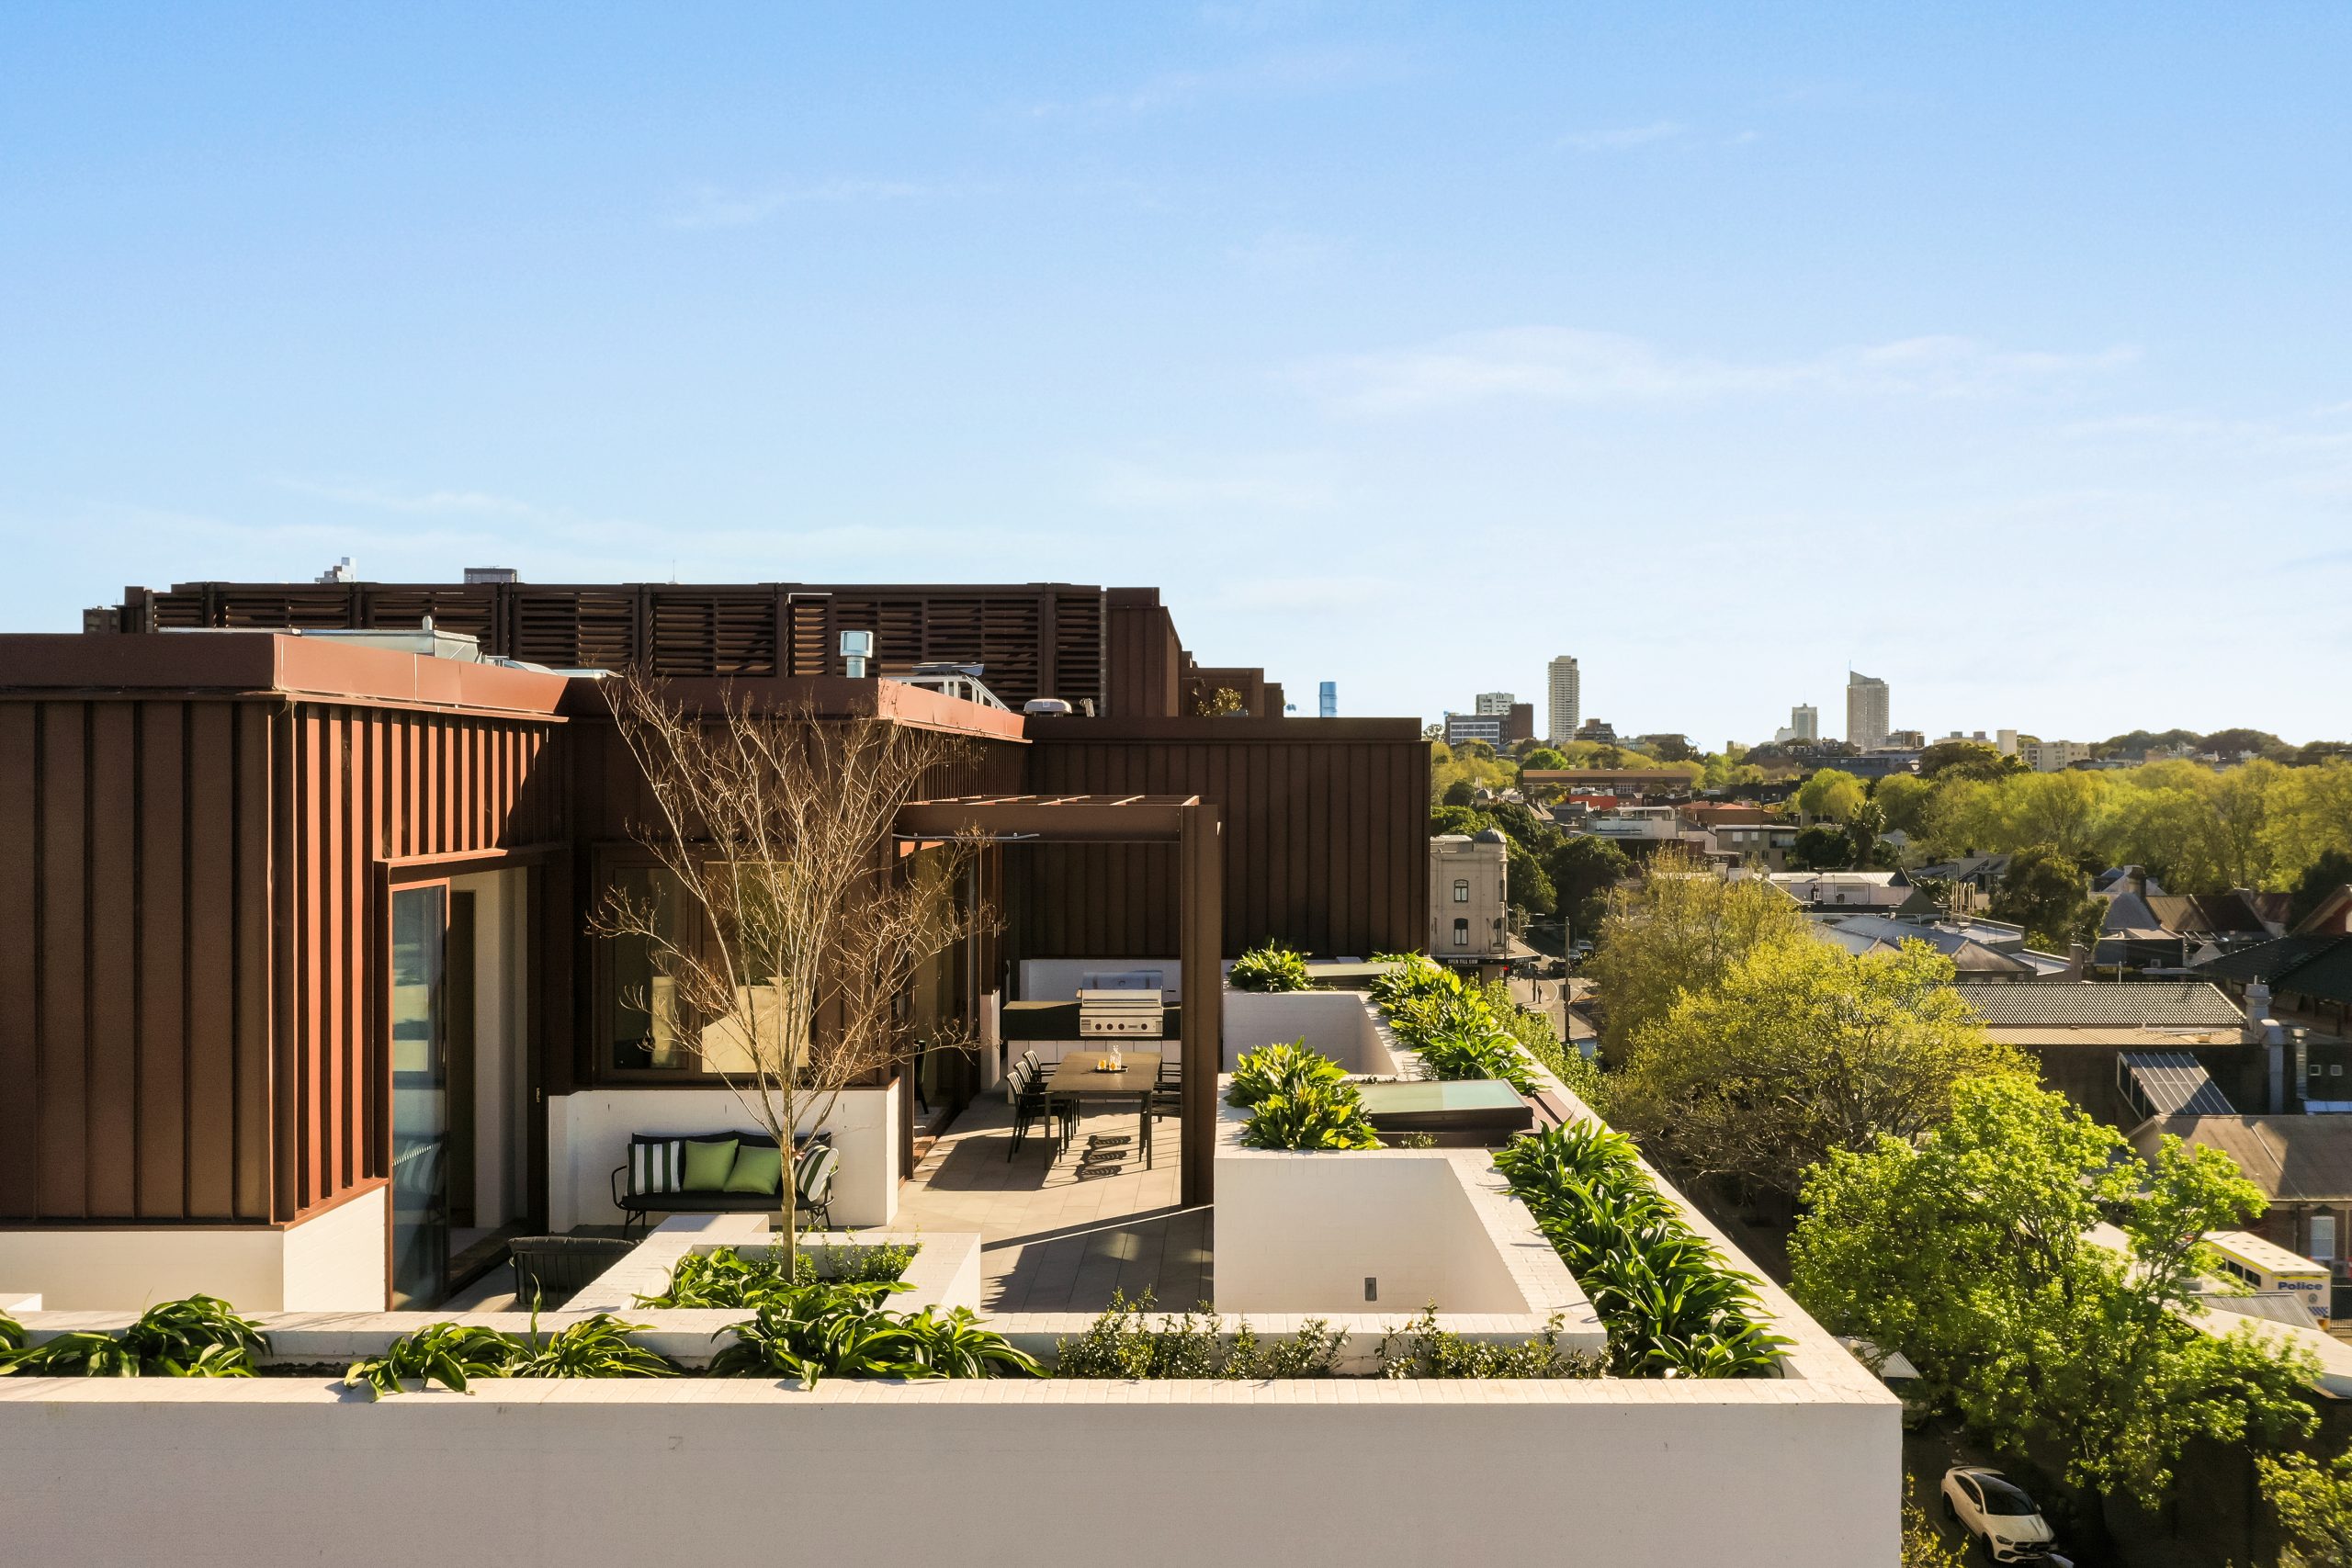
Measuring 211sqm of internal space, with a 136sqm terrace complete with landscaping, the penthouse is the brand new brainchild of Surry Hills local Adam Haddow, director of architecture at award-winning firm SJB.
Victoria Judge, senior associate and co-interior design lead at SJB says Surry Hills Village sets a new residential benchmark for the southern end of Surry Hills.
“The residential offering is well-appointed, confident, luxe and bohemian. Smart enough to know what makes good living, and cool enough to hold its own amongst design-centric Surry Hills.”
Allan Vidor, managing director of Toga Group, adds that the penthouse is the quintessential jewel in the crown of Surry Hills Village.
“Bringing together a distinct design that draws on the beauty and vibrancy of Sydney; grand spaces and the finest finishes across a significant footprint, located only a stone’s throw away from the exciting cultural hub of Crown St and Surry Hills.”
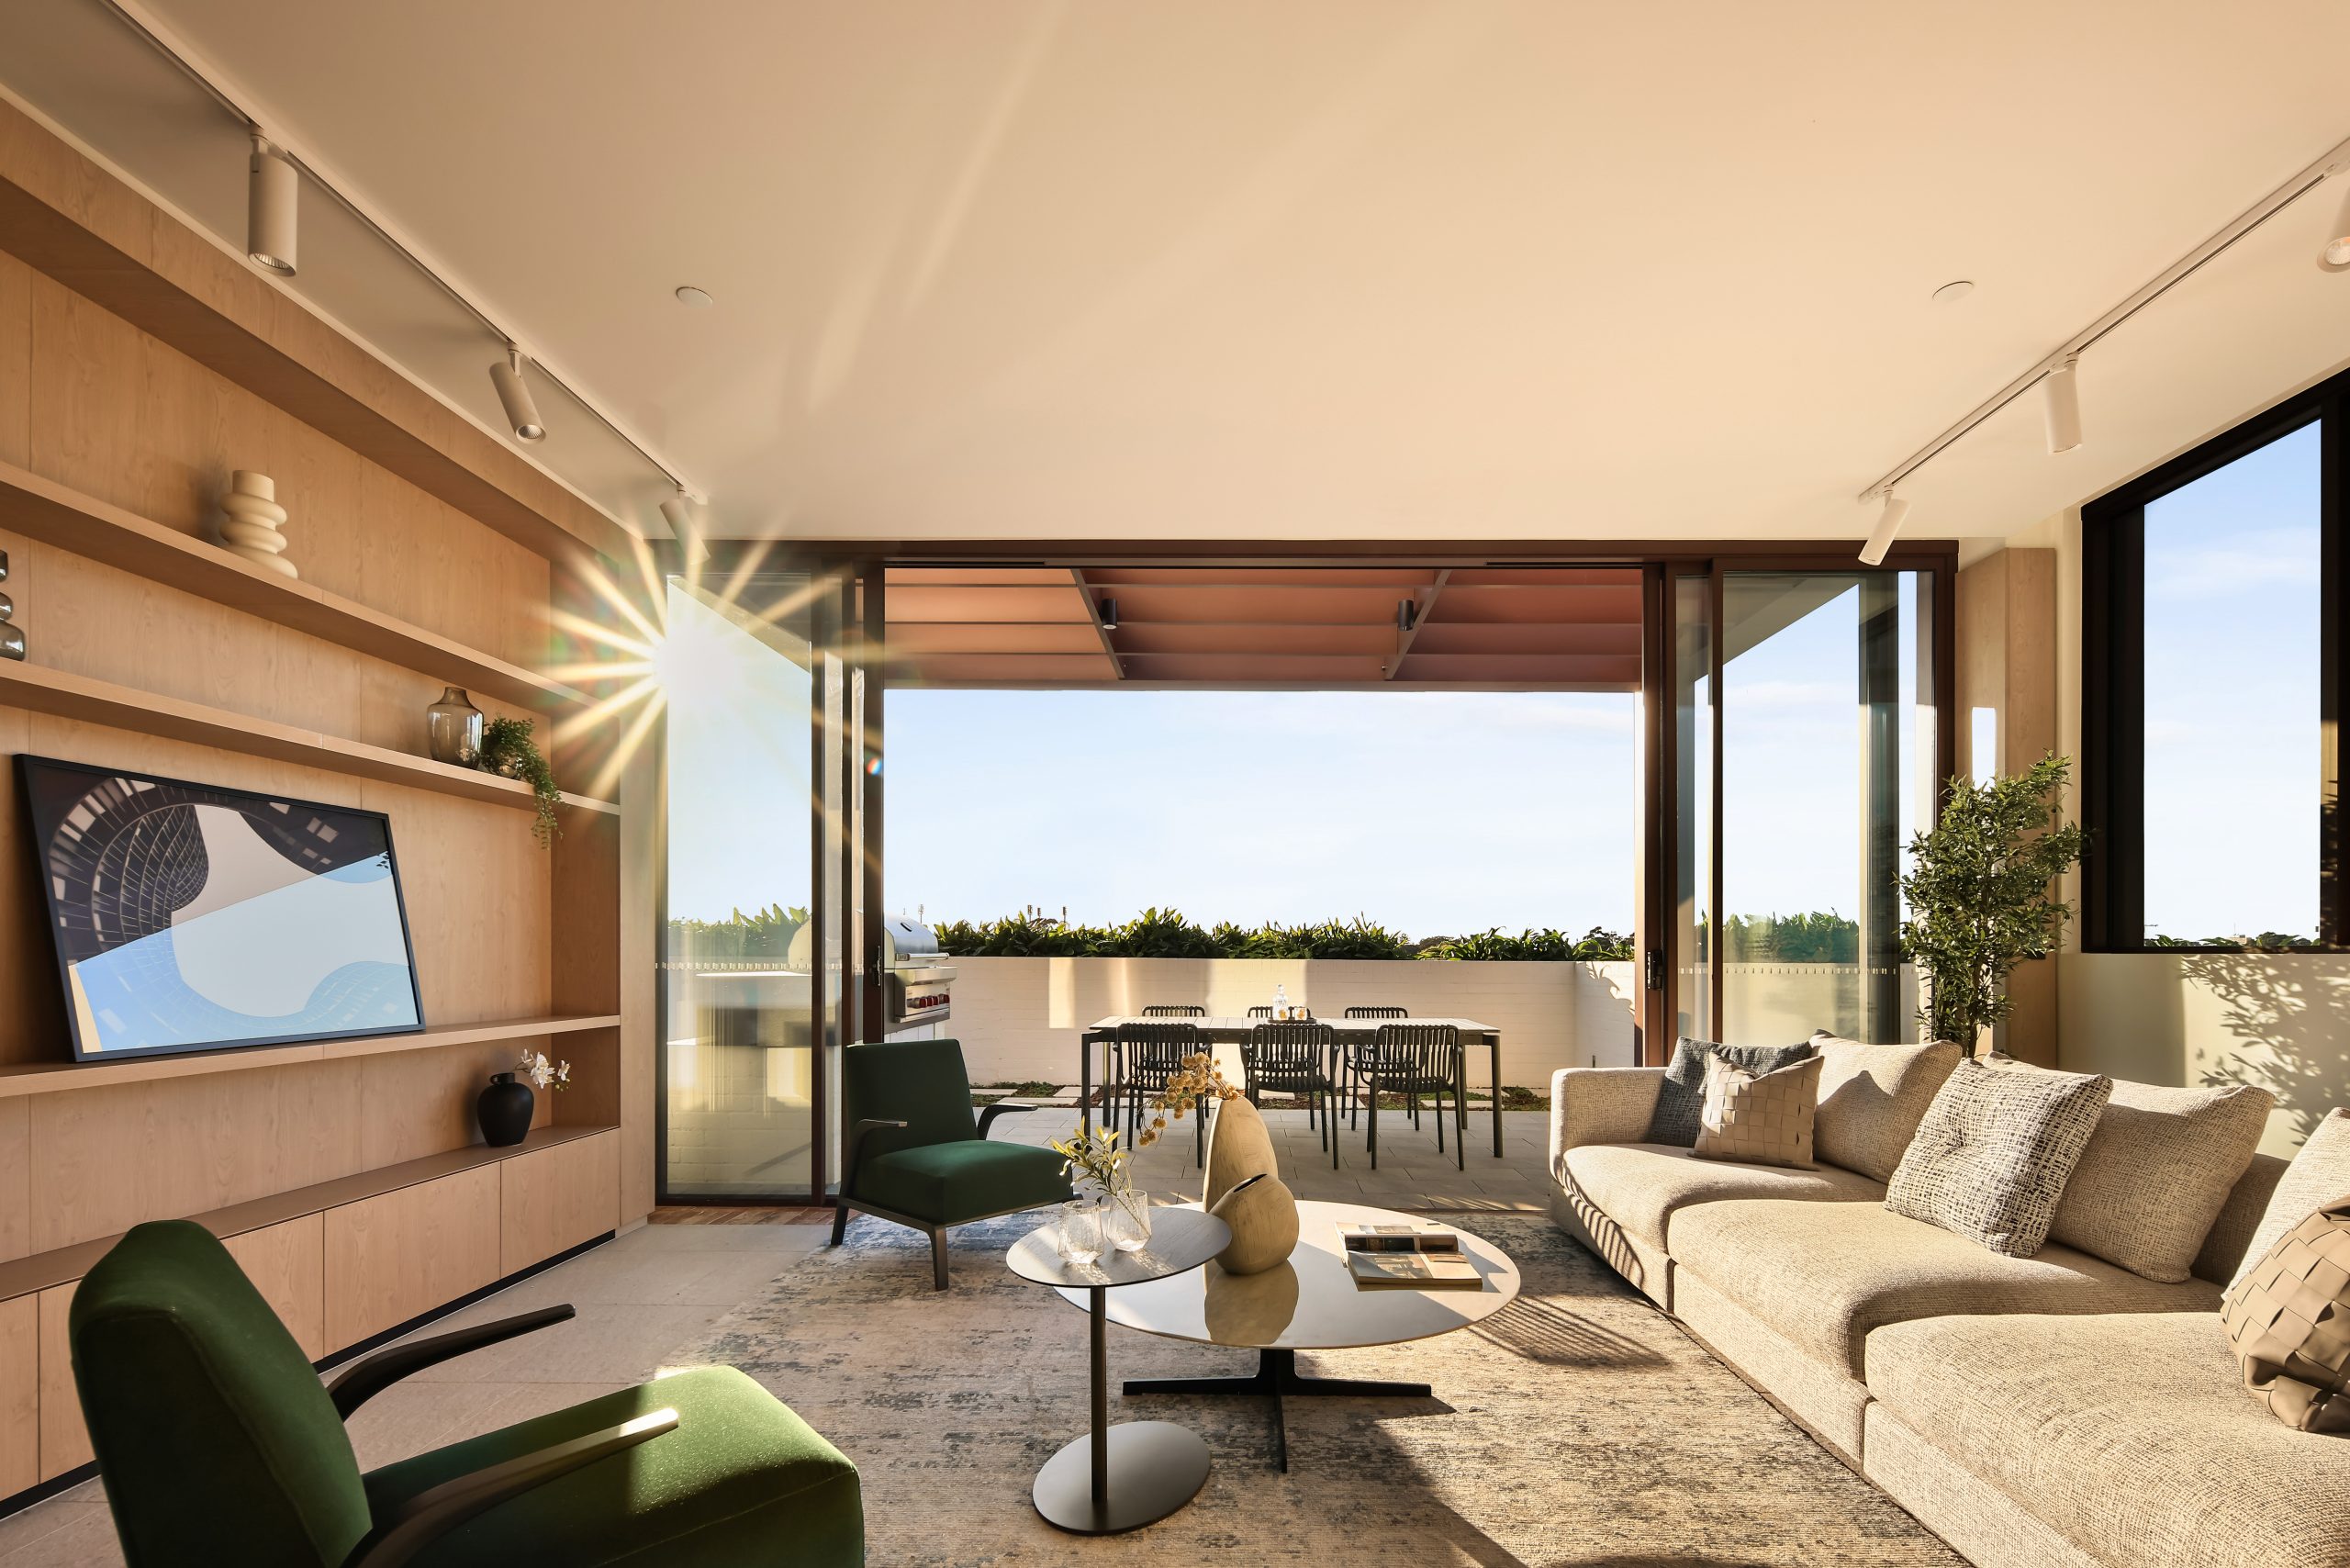
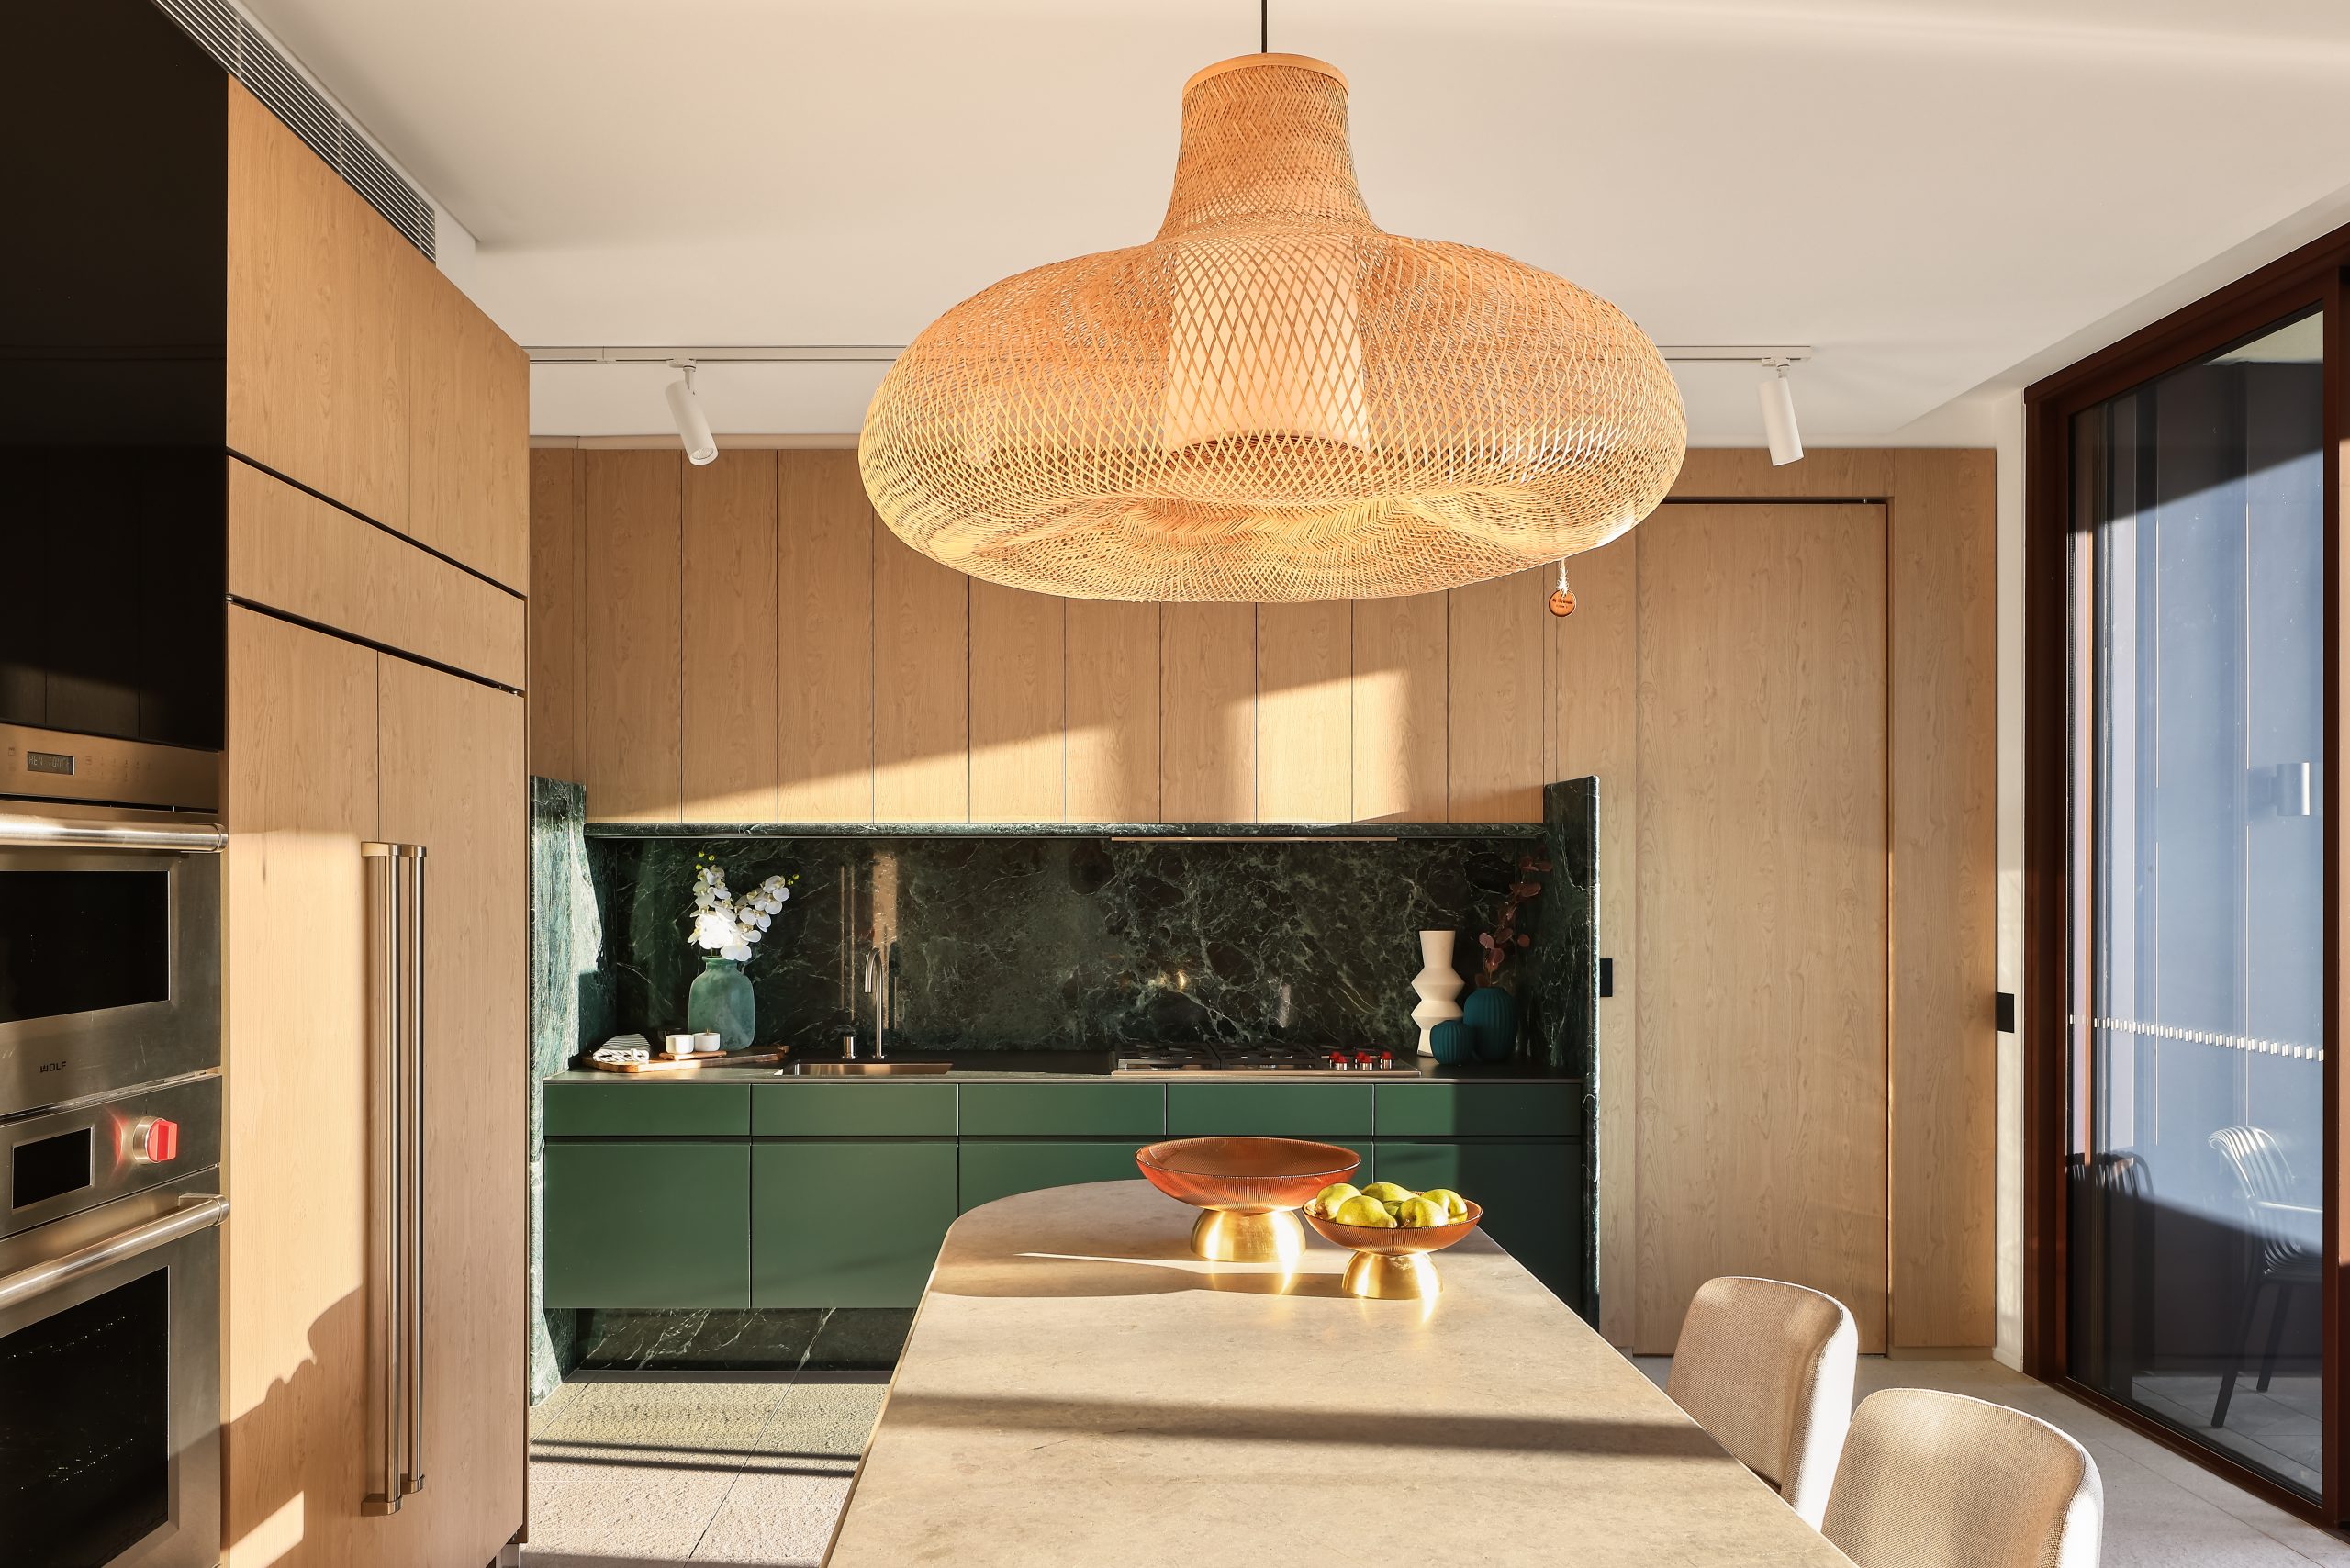
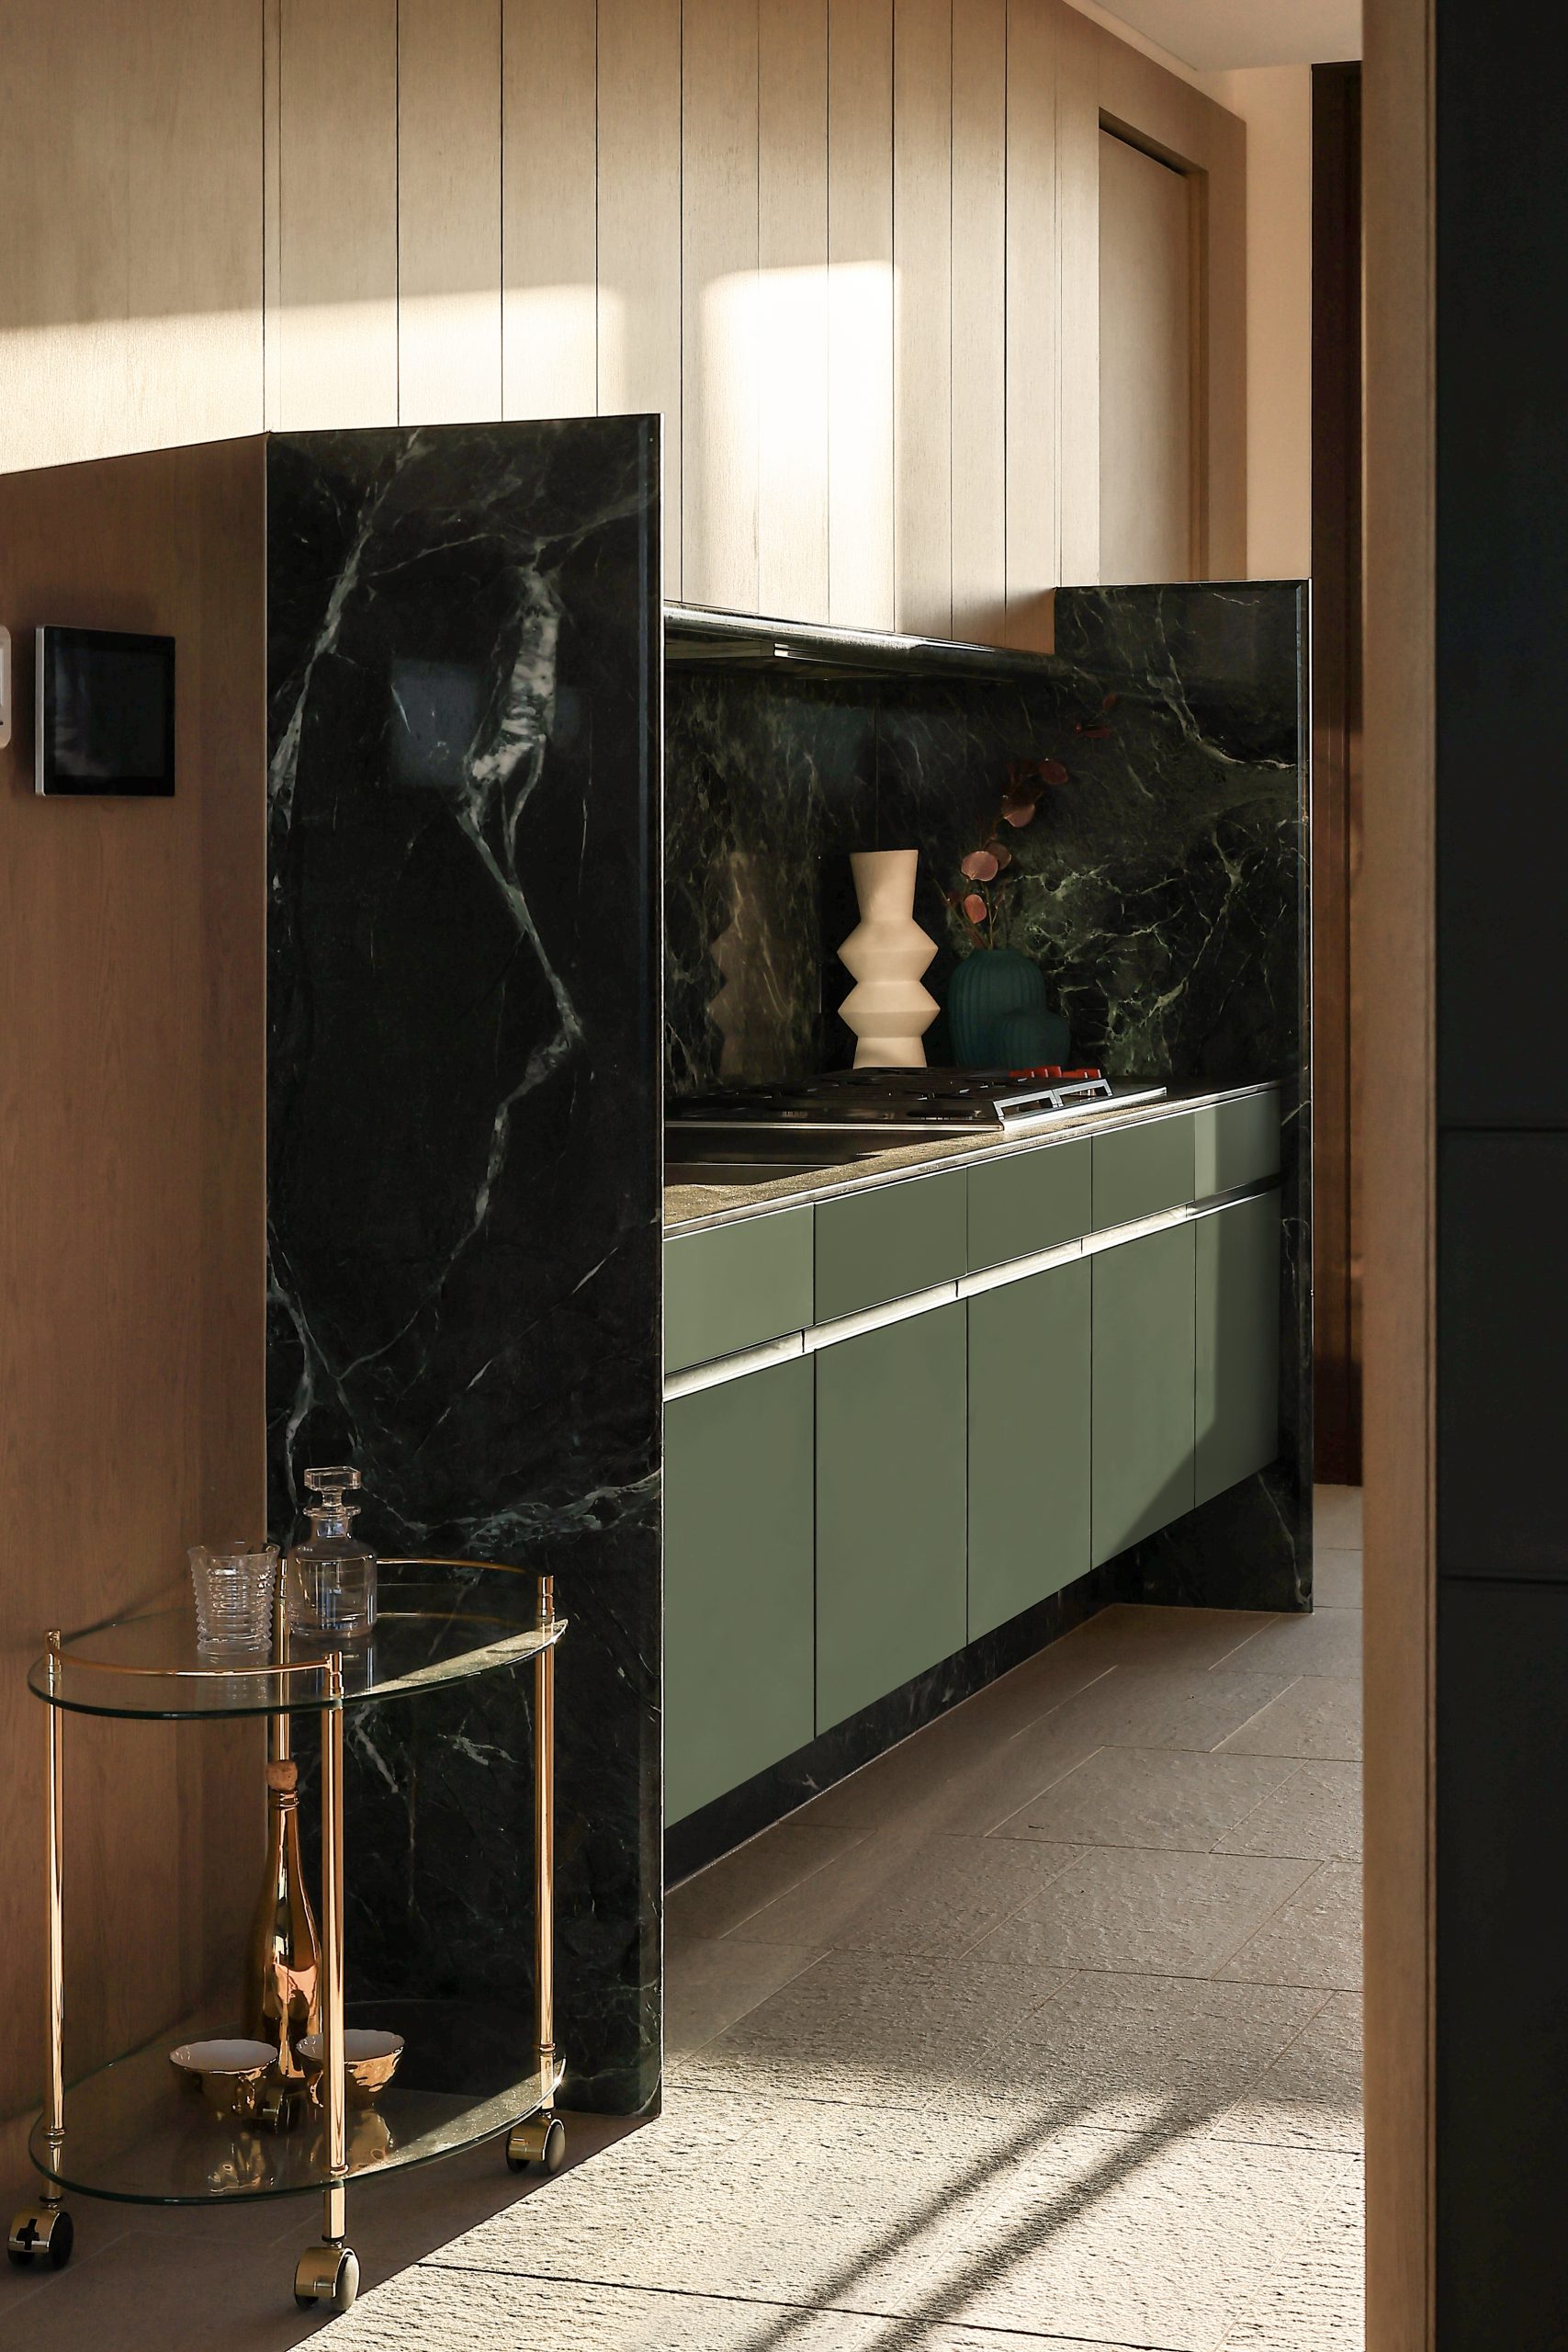
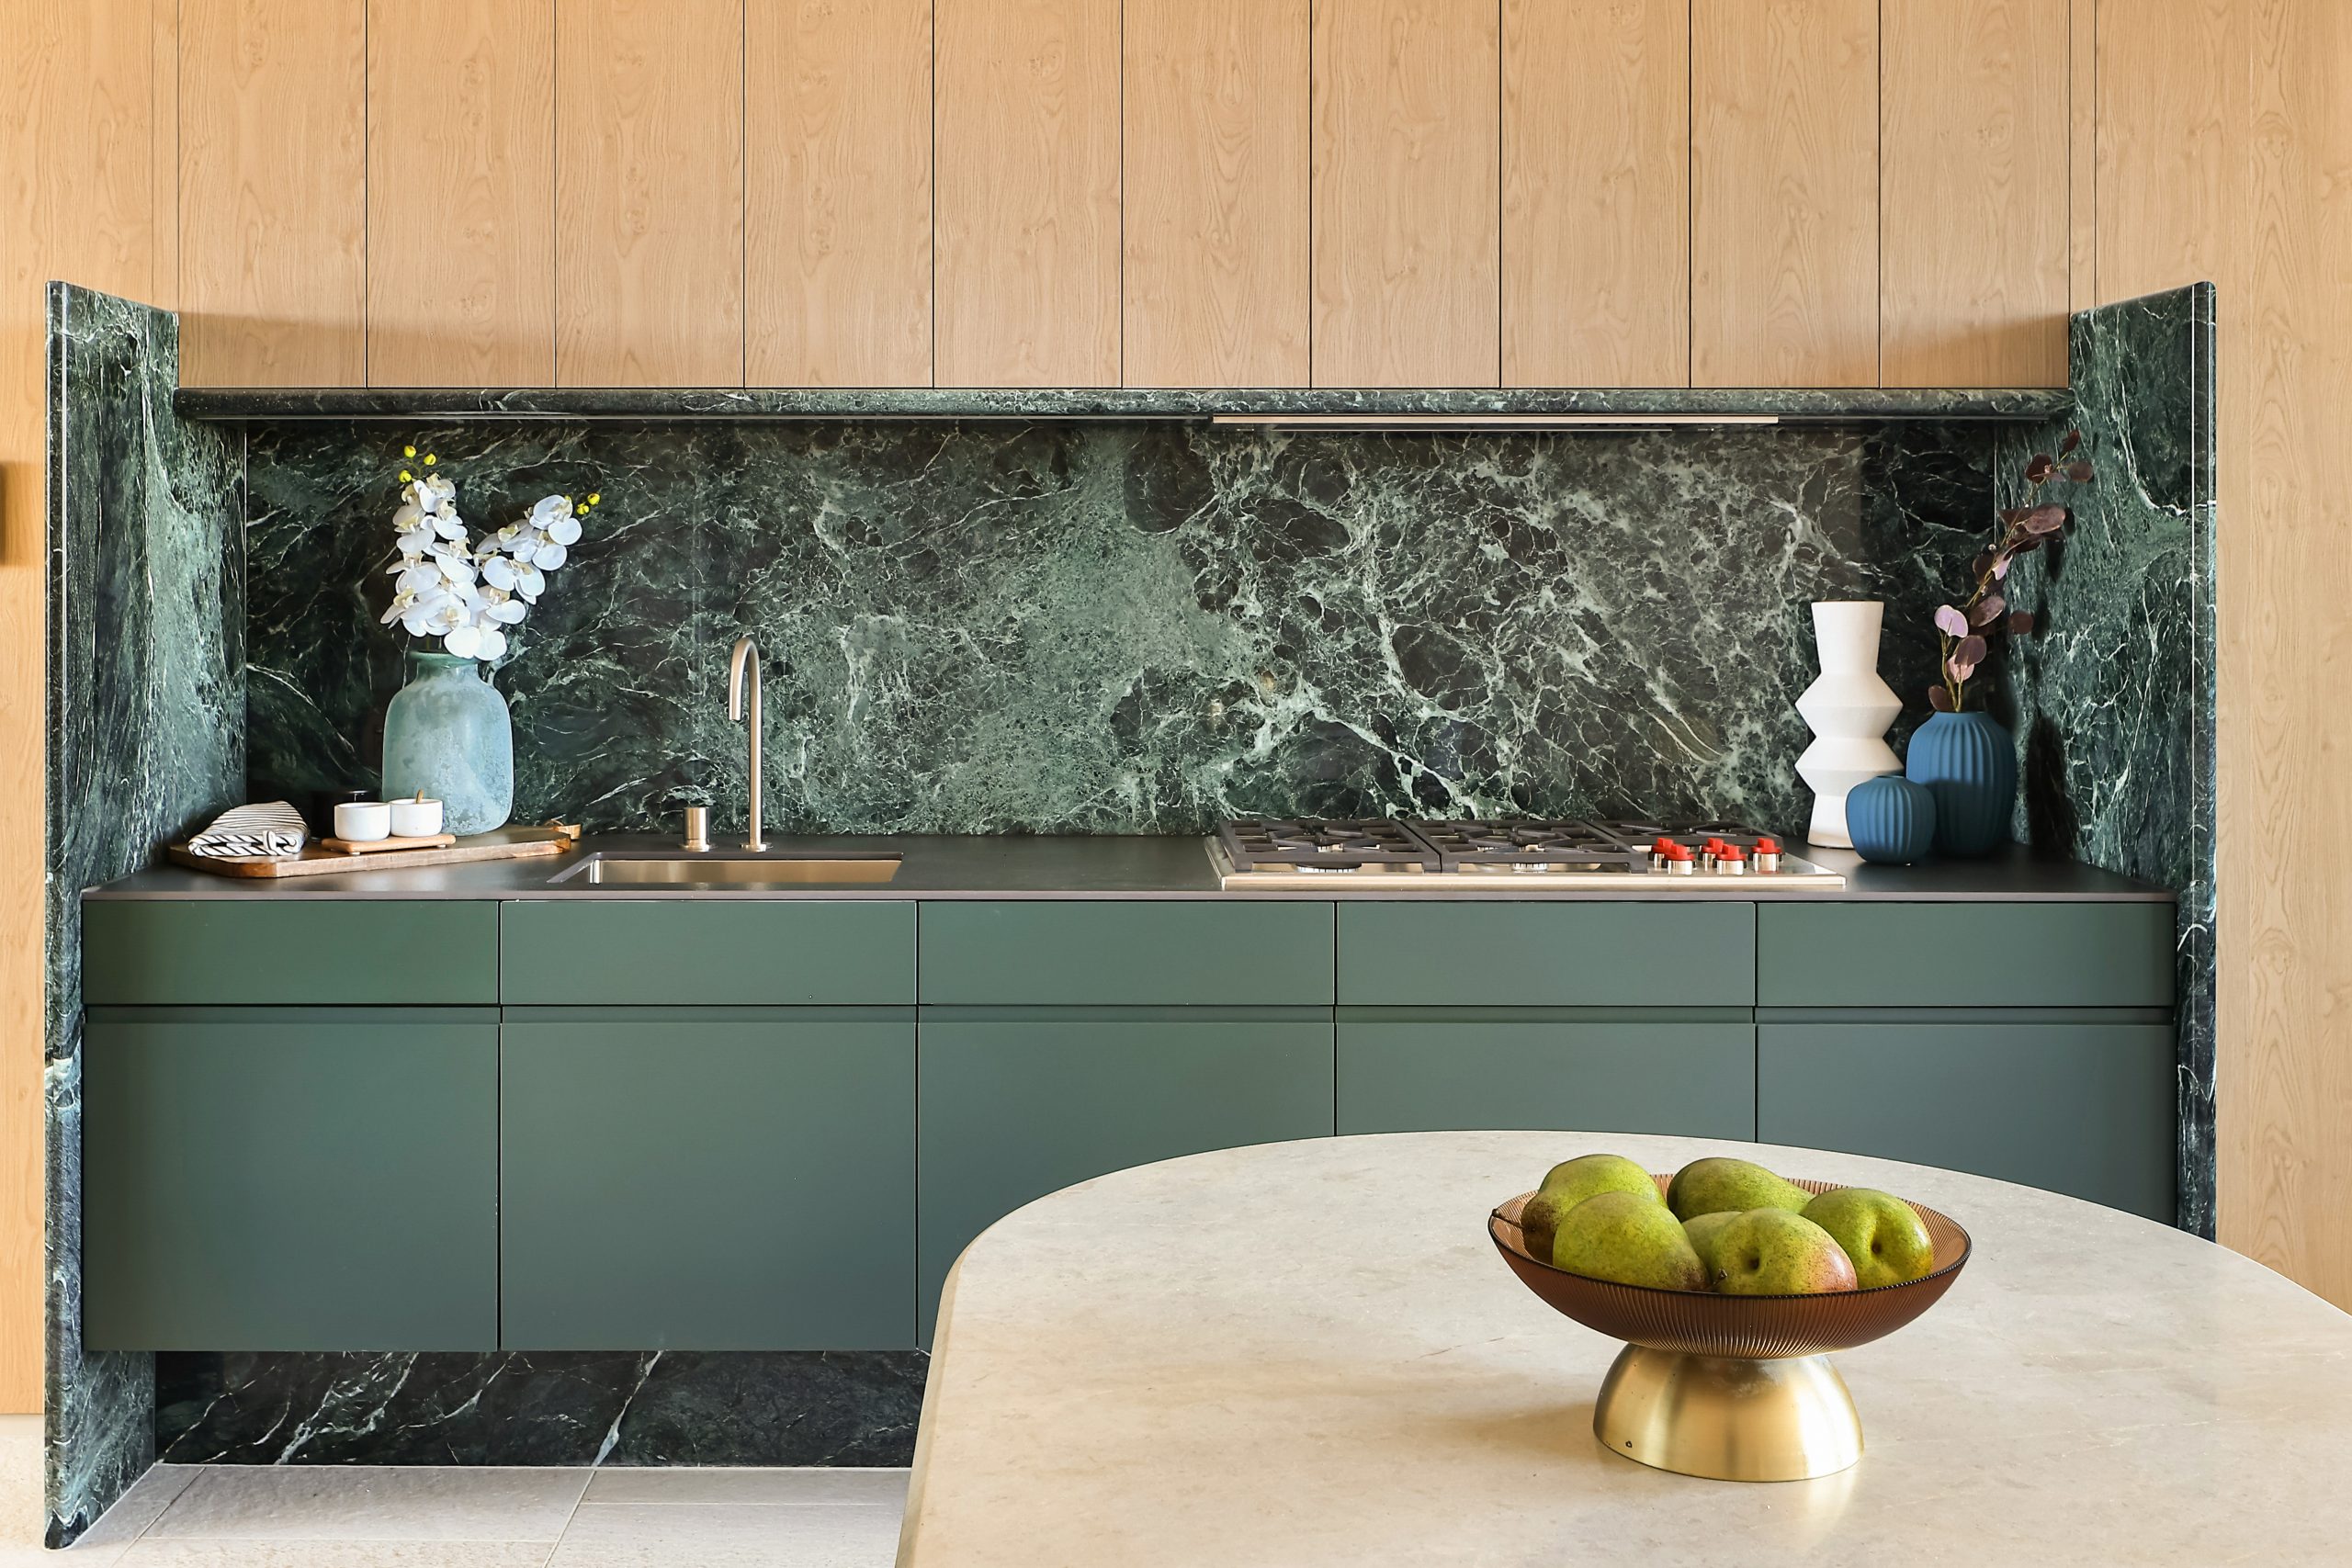
Created to maximise views of the city skyline and parkland, the top floor apartment has a practical layout including a wide private lobby leading to the main living room, a sleek kitchen featuring Pietra Verde marble and a concealed butler’s pantry Sub-Zero Wolf appliances, full-height Aspen elm joinery panels hiding storage throughout, flamed Saville stone flooring, a powder room, and two car spaces with a personal EV.
All three bedrooms have large wardrobes and ensuites with bathrooms fittings such as freestanding baths, artisan penny tiles, emerald marble surfaces and brushed-nickel accents.
Additional features of the entertainer’s home include leather-bound joinery doors opening to a full wet bar with Sub-Zero wine fridge and Sub-Zero Wolf barbecue.
The Surry Hills Village precinct will open in stages until autumn next year and once complete, Wunderlich Lane will be home to a collection of 25 restaurants and bars plus wellness and boutique retail. The EVE Hotel Sydney will open later in 2024, offering guests an immersive experience in the precinct’s art, culture, and culinary offerings.
The Surry Hills Village penthouse on Baptist is now finished and ready to move into with marketing through Toga Group and inquiries to 1800 554 556.
This stylish family home combines a classic palette and finishes with a flexible floorplan
Just 55 minutes from Sydney, make this your creative getaway located in the majestic Hawkesbury region.