


China’s Overcapacity Is Already Backfiring
Excess investment in industry isn’t made up by trading partners, and it has domestic consequences

 2 min
2 min
In the “ China Shock 2.0 ” narrative, not only is China a security threat and a low-end factory competitor, but it is also angling to swamp the West with cut-rate high-tech goods. There has been less focus on the downsides of such a strategy for China itself.
China’s first-quarter growth beat most estimates , rising 5.3% on the year—thanks mostly to strong industrial output and exports. But the economic data released Tuesday also showed that excess capacity is very real, and could be damaging to China itself.
While China’s industrial engine revved up in January and February , it downshifted again in March: output rose just 4.5% on the year, down sharply from January and February’s 7%. More tellingly, manufacturing capacity utilisation plummeted to 73.8% in the first quarter—its weakest, excluding the pandemic-affected first quarter of 2020, since at least 2015. In volume terms, China’s exports hit a nearly 10-year high in March. But in value terms they were barely above where they sat in October.
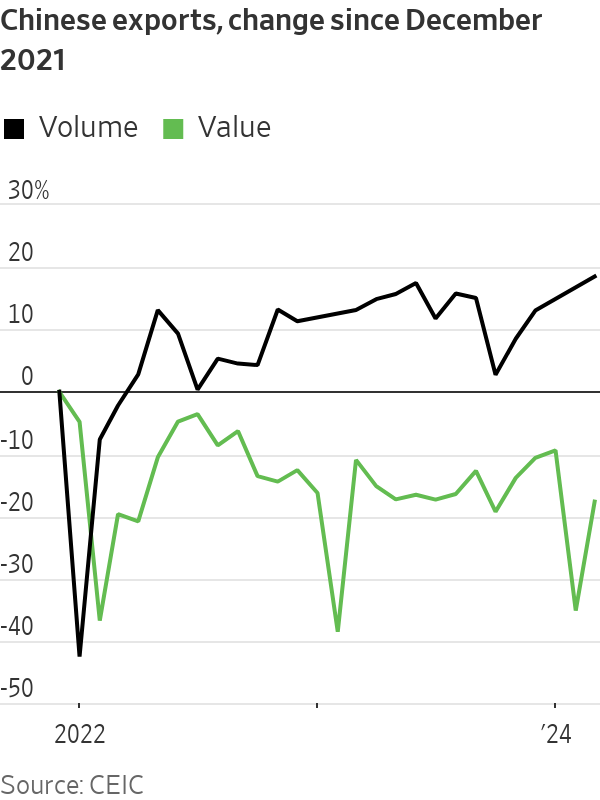
In other words, firms’ pricing power both at home and abroad is weakening and margin pressure is probably mounting: The March industrial financial data, which will be released later this month, will be worth watching.
So will private investment in manufacturing. If external demand, in value terms, doesn’t find a stronger footing soon and China’s domestic economy remains weak, then eventually such investment will need to slow. Otherwise the government, or state-owned banks, will have to start absorbing the cost of too many loans to industry more directly, as they already have with real estate and infrastructure .
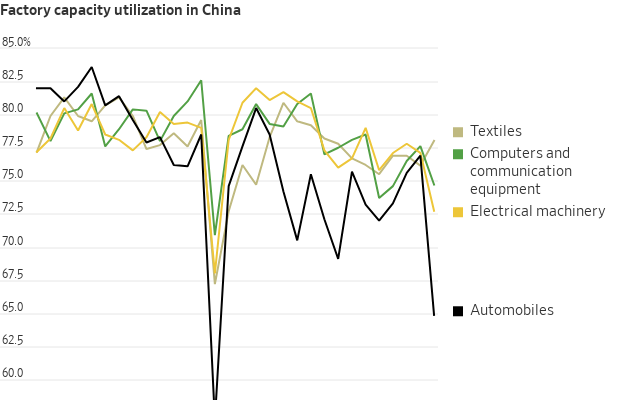
Particularly interesting is the breakdown of that capacity utilisation data itself. Falling run rates were especially obvious in Beijing’s favourite sectors like automobiles and electrical equipment—the so-called “new productive forces,” including electric vehicles, chips and solar panels, which policymakers have highlighted in recent speeches and have been stalking Western politicians’ nightmares. Automobile manufacturing utilisation rates fell below 65% in the first quarter: well below their previous low (excluding the first quarter of 2020) of 69.1% in mid-2016.
China’s traditional export sectors, on the other hand, have actually held up relatively well. Textiles utilisation rose in the first quarter, while run rates for computer and communication gear fell, but much less sharply.
Meanwhile, economy wide borrowing—excluding government bond issuance—weakened further in March, despite bond yields and interest rates near multiyear lows. If margin pressure starts to force some “new productive forces” to start slowing investment, fiscal policy would need to step in to prop up growth.
Alternatively, China can keep funnelling its excess savings into new manufacturing overcapacity—but Chinese banks and Beijing, not just China’s trade partners, will eventually end up footing the bill.
 Copyright 2020, Dow Jones & Company, Inc. All Rights Reserved Worldwide. LEARN MORE


A long-standing cultural cruise and a new expedition-style offering will soon operate side by side in French Polynesia.

The pandemic-fuelled love affair with casual footwear is fading, with Bank of America warning the downturn shows no sign of easing.


The pandemic-fuelled love affair with casual footwear is fading, with Bank of America warning the downturn shows no sign of easing.
2 minThe boom in casual footware ushered in by the pandemic has ended, a potential problem for companies such as Adidas that benefited from the shift to less formal clothing, Bank of America says.
The casual footwear business has been on the ropes since mid-2023 as people began returning to office.
Analyst Thierry Cota wrote that while most downcycles have lasted one to two years over the past two decades or so, the current one is different.
It “shows no sign of abating” and there is “no turning point in sight,” he said.
Adidas and Nike alone account for almost 60% of revenue in the casual footwear industry, Cota estimated, so the sector’s slower growth could be especially painful for them as opposed to brands that have a stronger performance-shoe segment. Adidas may just have it worse than Nike.
Cota downgraded Adidas stock to Underperform from Buy on Tuesday and slashed his target for the stock price to €160 (about $187) from €213. He doesn’t have a rating for Nike stock.
Shares of Adidas listed on the German stock exchange fell 4.5% Tuesday to €162.25. Nike stock was down 1.2%.
Adidas didn’t immediately respond to a request for comment.
Cota sees trouble for Adidas both in the short and long term.
Adidas’ lifestyle segment, which includes the Gazelles and Sambas brands, has been one of the company’s fastest-growing business, but there are signs growth is waning.
Lifestyle sales increased at a 10% annual pace in Adidas’ third quarter, down from 13% in the second quarter.
The analyst now predicts Adidas’ organic sales will grow by a 5% annual rate starting in 2027, down from his prior forecast of 7.5%.
The slower revenue growth will likewise weigh on profitability, Cota said, predicting that margins on earnings before interest and taxes will decline back toward the company’s long-term average after several quarters of outperforming. That could result in a cut to earnings per share.
Adidas stock had a rough 2025. Shares shed 33% in the past 12 months, weighed down by investor concerns over how tariffs, slowing demand, and increased competition would affect revenue growth.
Nike stock fell 9% throughout the period, reflecting both the company’s struggles with demand and optimism over a turnaround plan CEO Elliott Hill rolled out in late 2024.
Investors’ confidence has faded following Nike’s December earnings report, which suggested that a sustained recovery is still several quarters away. Just how many remains anyone’s guess.
But if Adidas’ challenges continue, as Cota believes they will, it could open up some space for Nike to claw back any market share it lost to its rival.
Investors should keep in mind, however, that the field has grown increasingly crowded in the past five years. Upstarts such as On Holding and Hoka also present a formidable challenge to the sector’s legacy brands.
Shares of On and Deckers Outdoor , Hoka’s parent company, fell 11% and 48%, respectively, in 2025, but analysts are upbeat about both companies’ fundamentals as the new year begins.
The battle of the sneakers is just getting started.

ABC Bullion has launched a pioneering investment product that allows Australians to draw regular cashflow from their precious metal holdings.

In the remote waters of Indonesia’s Anambas Islands, Bawah Reserve is redefining what it means to blend barefoot luxury with environmental stewardship.