U.S. Home Sales Fell for Ninth Straight Month in October
Higher mortgage rates driven by aggressive Federal Reserve interest-rate increases are pushing buyers out of the market

 4 min
4 min
U.S. existing-home sales fell for a ninth straight month in October, the longest streak of declines on record, as the steepest mortgage rates in two decades and high home prices are keeping many buyers on the sidelines.
Sales of previously owned homes declined 5.9% in October from the prior month to a seasonally adjusted annual rate of 4.43 million, the weakest rate since May 2020, the National Association of Realtors said Friday. October sales fell 28.4% from a year earlier, the biggest annual decline since February 2008.
Home sales have been declining each month since February, the longest stretch since NAR began tracking this data in 1999. From their recent peak in January, existing-home sales have dropped about 32%.
The slowdown is due to a rapid increase in borrowing rates. The average rate on a 30-year fixed-rate mortgage began to climb rapidly in the first quarter and rose above 7% earlier this month. Mortgage rates eased this week but are still more than double where they stood a year ago.
That surge in borrowing costs has driven away potential home buyers and led many would-be sellers to stay put, keeping inventory for sale tight. First-time buyers who have stepped back from the market are now facing rising rents and high inflation that can make it more difficult to save for down payments.
This year’s drop in home sales marks one of the biggest impacts from the Federal Reserve’s aggressive interest-rate increases aimed at cooling the economy and bringing down high inflation. Home sales are highly interest-rate sensitive and fuel related economic activity such as spending on renovations, furniture and appliances.
The housing-market slowdown is expected to persist in 2023 because home-buying affordability is near its lowest level in decades. Home prices have continued to rise on an annual basis due to low supply, though the pace of home-price growth has slowed sharply.
October’s 6.6% median price increase from a year ago is the lowest since June 2020.
Some economists expect significant price declines next year. “We have a demand side that has evaporated so rapidly,” said Diane Swonk, chief economist at KPMG, who is forecasting home prices nationally to fall 20% by the end of 2023 compared with this year.
Anne and Charles Rudig decided last year to move from Connecticut to Florida for a lower cost of living, including lower taxes. They bought a house in Melrose, Fla., in December 2021, but didn’t move immediately because the house needed repairs.
They watched mortgage rates rise and worried they would miss out on selling their Connecticut home during the hot market. “We really felt like we were running a race,” Mrs. Rudig said.
After the Rudigs listed their house in September, it sat on the market for more than a month, but they ultimately sold it in October for $302,000, about 4.2% above the list price. “The relief is enormous,” Mrs. Rudig said.
This week saw a pickup in home-buying interest as some buyers rushed to take advantage of the sudden drop in borrowing rates, which Freddie Mac said fell to 6.61%. Mortgage applications for home purchases rose 4% on a seasonally adjusted basis in the week ended Nov. 11 from the prior week, according to the Mortgage Bankers Association.
But home purchases are unlikely to become affordable for many first-time buyers unless rates drop below 6%, Ms. Swonk said.
“I’m not overwhelmingly confident that we’re going to see a rapid turnaround in this market anytime soon,” she said.
The Fed is expected to continue raising rates. Inflation stayed high in October, the labor market remained tight and consumers continued to spend robustly at retailers—all signs the economy is still running too hot for the Fed’s comfort.
“The rising mortgage rate is consistent with falling home sales,” said Lawrence Yun, NAR’s chief economist.
Excluding the early months of the Covid-19 pandemic, October’s existing-home sales rate was the lowest since December 2011, Mr. Yun said.
Broader economic uncertainty has also made buyers more nervous about making home purchases, real-estate agents say.
Homes typically go under contract a month or two before the contract closes, so the October data largely reflect purchase decisions made in September and August.
Demand also typically slows in the winter compared with the spring and summer.
Nationally, there were 1.22 million homes for sale or under contract at the end of October, down 0.8% from both September 2022 and October 2021, NAR said.
“The people that are selling right now are people that, for whatever reason, have to sell,” said Jennifer Barnes, a real-estate broker in Chicago.
Existing-home sales fell the most month-over-month in the West, down 9.1%, and in the Northeast, down 6.6%.
Erika Delk and Daniel Duke started house hunting in Santa Barbara, Calif., in 2021, and struggled to compete against cash buyers.
“We probably saw about 100 homes in person,” said Ms. Delk, who is 30. “Homes were just going for ridiculous prices.”
The couple lowered their budget as mortgage rates started rising, but they benefited from less competition in the market, she said. They bought a four-bedroom home in October at its listing price and negotiated a credit from the seller to pay for some repairs.
“There was a lot of, ‘Should we be doing this? Would it be better to wait and see if rates come back down?’” Ms. Delk said. But “we want to be here for a while, and the market really only matters when you buy your home and when you sell your home.”
Home builders have pulled back from new construction and started cutting prices in response to lower demand.
“Finding buyers who are both motivated and qualified is the new game in town,” said Eric Lipar, chief executive of builder LGI Homes Inc., in an earnings call this month.
A measure of U.S. home-builder confidence fell for the 11th straight month in November to the lowest level since April 2020, the National Association of Home Builders said this week.
Housing starts, a measure of U.S. home-building, fell 4.2% in October from September, the Commerce Department said this week. Residential permits, which can be a bellwether for future home construction, fell 2.4%.
News Corp, owner of The Wall Street Journal, also operates Realtor.com under license from NAR.
 Copyright 2020, Dow Jones & Company, Inc. All Rights Reserved Worldwide. LEARN MORE


This stylish family home combines a classic palette and finishes with a flexible floorplan

Just 55 minutes from Sydney, make this your creative getaway located in the majestic Hawkesbury region.

Ahead of the Games, a breakdown of the city’s most desirable places to live
7 min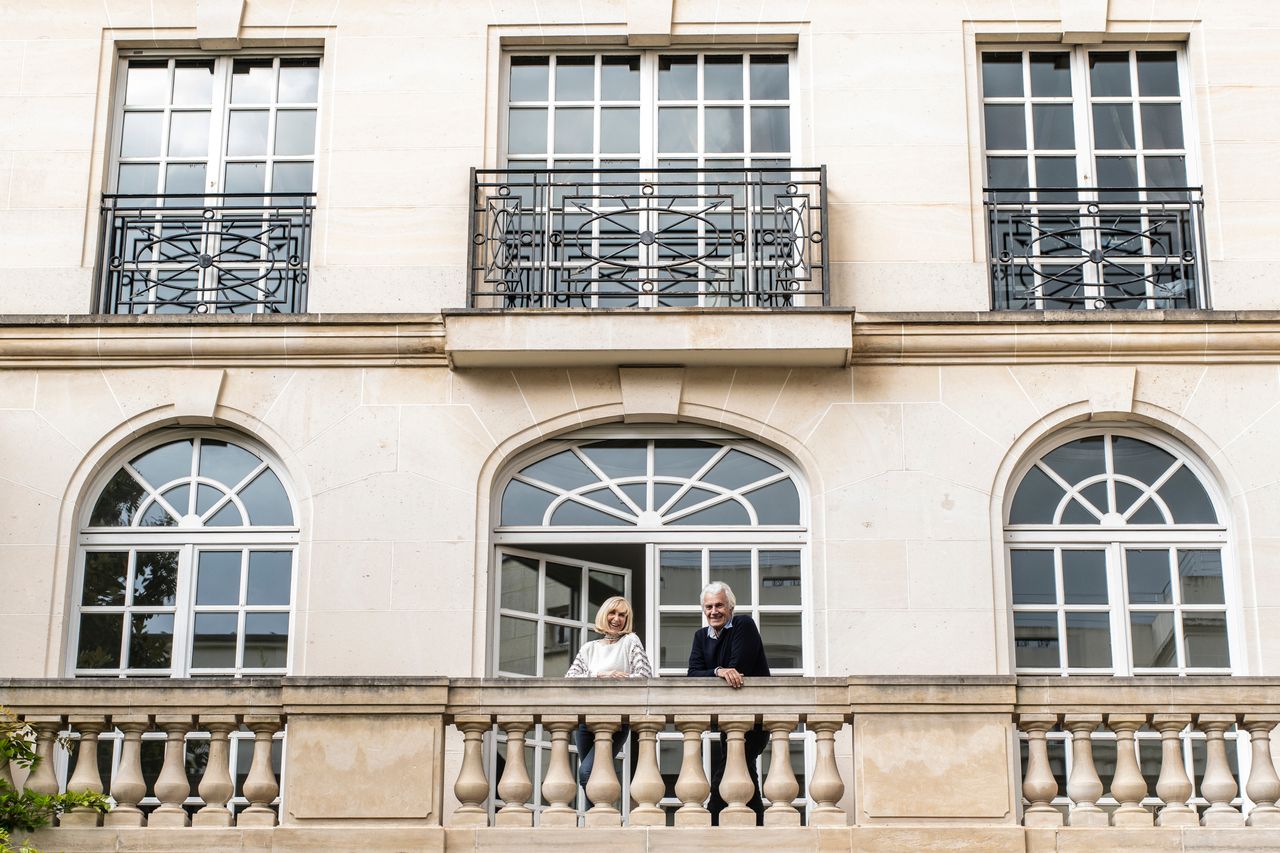
PARIS —Paris has long been a byword for luxurious living. The traditional components of the upscale home, from parquet floors to elaborate moldings, have their origins here. Yet settling down in just the right address in this low-rise, high-density city may be the greatest luxury of all.
Tradition reigns supreme in Paris real estate, where certain conditions seem set in stone—the western half of the city, on either side of the Seine, has long been more expensive than the east. But in the fashion world’s capital, parts of the housing market are also subject to shifting fads. In the trendy, hilly northeast, a roving cool factor can send prices in this year’s hip neighborhood rising, while last year’s might seem like a sudden bargain.
This week, with the opening of the Olympic Games and the eyes of the world turned toward Paris, The Wall Street Journal looks at the most expensive and desirable areas in the City of Light.
The Most Expensive Arrondissement: the 6th
Known for historic architecture, elegant apartment houses and bohemian street cred, the 6th Arrondissement is Paris’s answer to Manhattan’s West Village. Like its New York counterpart, the 6th’s starving-artist days are long behind it. But the charm that first wooed notable residents like Gertrude Stein and Jean-Paul Sartre is still largely intact, attracting high-minded tourists and deep-pocketed homeowners who can afford its once-edgy, now serene atmosphere.
Le Breton George V Notaires, a Paris notary with an international clientele, says the 6th consistently holds the title of most expensive arrondissement among Paris’s 20 administrative districts, and 2023 was no exception. Last year, average home prices reached $1,428 a square foot—almost 30% higher than the Paris average of $1,100 a square foot.
According to Meilleurs Agents, the Paris real estate appraisal company, the 6th is also home to three of the city’s five most expensive streets. Rue de Furstemberg, a secluded loop between Boulevard Saint-Germain and the Seine, comes in on top, with average prices of $2,454 a square foot as of March 2024.
For more than two decades, Kyle Branum, a 51-year-old attorney, and Kimberly Branum, a 60-year-old retired CEO, have been regular visitors to Paris, opting for apartment rentals and ultimately an ownership interest in an apartment in the city’s 7th Arrondissement, a sedate Left Bank district known for its discreet atmosphere and plutocratic residents.
“The 7th was the only place we stayed,” says Kimberly, “but we spent most of our time in the 6th.”
In 2022, inspired by the strength of the dollar, the Branums decided to fulfil a longstanding dream of buying in Paris. Working with Paris Property Group, they opted for a 1,465-square-foot, three-bedroom in a building dating to the 17th century on a side street in the 6th Arrondissement. They paid $2.7 million for the unit and then spent just over $1 million on the renovation, working with Franco-American visual artist Monte Laster, who also does interiors.
The couple, who live in Santa Barbara, Calif., plan to spend about three months a year in Paris, hosting children and grandchildren, and cooking after forays to local food markets. Their new kitchen, which includes a French stove from luxury appliance brand Lacanche, is Kimberly’s favourite room, she says.
Another American, investor Ashley Maddox, 49, is also considering relocating.
In 2012, the longtime Paris resident bought a dingy, overstuffed 1,765-square-foot apartment in the 6th and started from scratch. She paid $2.5 million and undertook a gut renovation and building improvements for about $800,000. A centrepiece of the home now is the one-time salon, which was turned into an open-plan kitchen and dining area where Maddox and her three children tend to hang out, American-style. Just outside her door are some of the city’s best-known bakeries and cheesemongers, and she is a short walk from the Jardin du Luxembourg, the Left Bank’s premier green space.
“A lot of the majesty of the city is accessible from here,” she says. “It’s so central, it’s bananas.” Now that two of her children are going away to school, she has listed the four-bedroom apartment with Varenne for $5 million.
The Most Expensive Neighbourhoods: Notre-Dame and Invalides
Garrow Kedigian is moving up in the world of Parisian real estate by heading south of the Seine.
During the pandemic, the Canada-born, New York-based interior designer reassessed his life, he says, and decided “I’m not going to wait any longer to have a pied-à-terre in Paris.”
He originally selected a 1,130-square-foot one-bedroom in the trendy 9th Arrondissement, an up-and-coming Right Bank district just below Montmartre. But he soon realised it was too small for his extended stays, not to mention hosting guests from out of town.
After paying about $1.6 million in 2022 and then investing about $55,000 in new decor, he put the unit up for sale in early 2024 and went house-shopping a second time. He ended up in the Invalides quarter of the 7th Arrondissement in the shadow of one Paris’s signature monuments, the golden-domed Hôtel des Invalides, which dates to the 17th century and is fronted by a grand esplanade.
His new neighbourhood vies for Paris’s most expensive with the Notre-Dame quarter in the 4th Arrondissement, centred on a few islands in the Seine behind its namesake cathedral. According to Le Breton, home prices in the Notre-Dame neighbourhood were $1,818 a square foot in 2023, followed by $1,568 a square foot in Invalides.
After breaking even on his Right Bank one-bedroom, Kedigian paid $2.4 million for his new 1,450-square-foot two-bedroom in a late 19th-century building. It has southern exposures, rounded living-room windows and “gorgeous floors,” he says. Kedigian, who bought the new flat through Junot Fine Properties/Knight Frank, plans to spend up to $435,000 on a renovation that will involve restoring the original 12-foot ceiling height in many of the rooms, as well as rescuing the ceilings’ elaborate stucco detailing. He expects to finish in 2025.
Over in the Notre-Dame neighbourhood, Belles demeures de France/Christie’s recently sold a 2,370-square-foot, four-bedroom home for close to the asking price of about $8.6 million, or about $3,630 a square foot. Listing agent Marie-Hélène Lundgreen says this places the unit near the very top of Paris luxury real estate, where prime homes typically sell between $2,530 and $4,040 a square foot.
The Most Expensive Suburb: Neuilly-sur-Seine
The Boulevard Périphérique, the 22-mile ring road that surrounds Paris and its 20 arrondissements, was once a line in the sand for Parisians, who regarded the French capital’s numerous suburbs as something to drive through on their way to and from vacation. The past few decades have seen waves of gentrification beyond the city’s borders, upgrading humble or industrial districts to the north and east into prime residential areas. And it has turned Neuilly-sur-Seine, just northwest of the city, into a luxury compound of first resort.
In 2023, Neuilly’s average home price of $1,092 a square foot made the leafy, stately community Paris’s most expensive suburb.
Longtime residents, Alain and Michèle Bigio, decided this year is the right time to list their 7,730-square-foot, four-bedroom townhouse on a gated Neuilly street.
The couple, now in their mid 70s, completed the home in 1990, two years after they purchased a small parcel of garden from the owners next door for an undisclosed amount. Having relocated from a white-marble château outside Paris, the couple echoed their previous home by using white- and cream-coloured stone in the new four-story build. The Bigios, who will relocate just back over the border in the 16th Arrondissement, have listed the property with Emile Garcin Propriétés for $14.7 million.
The couple raised two adult children here and undertook upgrades in their empty-nester years—most recently, an indoor pool in the basement and a new elevator.
The cool, pale interiors give way to dark and sardonic images in the former staff’s quarters in the basement where Alain works on his hobby—surreal and satirical paintings, whose risqué content means that his wife prefers they stay downstairs. “I’m not a painter,” he says. “But I paint.”
The Trendiest Arrondissement: the 9th
French interior designer Julie Hamon is theatre royalty. Her grandfather was playwright Jean Anouilh, a giant of 20th-century French literature, and her sister is actress Gwendoline Hamon. The 52-year-old, who divides her time between Paris and the U.K., still remembers when the city’s 9th Arrondissement, where she and her husband bought their 1,885-square-foot duplex in 2017, was a place to have fun rather than put down roots. Now, the 9th is the place to do both.
The 9th, a largely 19th-century district, is Paris at its most urban. But what it lacks in parks and other green spaces, it makes up with nightlife and a bustling street life. Among Paris’s gentrifying districts, which have been transformed since 2000 from near-slums to the brink of luxury, the 9th has emerged as the clear winner. According to Le Breton, average 2023 home prices here were $1,062 a square foot, while its nearest competitors for the cool crown, the 10th and the 11th, have yet to break $1,011 a square foot.
A co-principal in the Bobo Design Studio, Hamon—whose gut renovation includes a dramatic skylight, a home cinema and air conditioning—still seems surprised at how far her arrondissement has come. “The 9th used to be well known for all the theatres, nightclubs and strip clubs,” she says. “But it was never a place where you wanted to live—now it’s the place to be.”
With their youngest child about to go to college, she and her husband, 52-year-old entrepreneur Guillaume Clignet, decided to list their Paris home for $3.45 million and live in London full-time. Propriétés Parisiennes/Sotheby’s is handling the listing, which has just gone into contract after about six months on the market.
The 9th’s music venues were a draw for 44-year-old American musician and piano dealer, Ronen Segev, who divides his time between Miami and a 1,725-square-foot, two-bedroom in the lower reaches of the arrondissement. Aided by Paris Property Group, Segev purchased the apartment at auction during the pandemic, sight unseen, for $1.69 million. He spent $270,000 on a renovation, knocking down a wall to make a larger salon suitable for home concerts.
During the Olympics, Segev is renting out the space for about $22,850 a week to attendees of the Games. Otherwise, he prefers longer-term sublets to visiting musicians for $32,700 a month.
Most Exclusive Address: Avenue Junot
Hidden in the hilly expanses of the 18th Arrondissement lies a legendary street that, for those in the know, is the city’s most exclusive address. Avenue Junot, a bucolic tree-lined lane, is a fairy-tale version of the city, separate from the gritty bustle that surrounds it.
Homes here rarely come up for sale, and, when they do, they tend to be off-market, or sold before they can be listed. Martine Kuperfis—whose Paris-based Junot Group real-estate company is named for the street—says the most expensive units here are penthouses with views over the whole of the city.
In 2021, her agency sold a 3,230-square-foot triplex apartment, with a 1,400-square-foot terrace, for $8.5 million. At about $2,630 a square foot, that is three times the current average price in the whole of the 18th.
Among its current Junot listings is a 1930s 1,220-square-foot townhouse on the avenue’s cobblestone extension, with an asking price of $2.8 million.
This stylish family home combines a classic palette and finishes with a flexible floorplan
Just 55 minutes from Sydney, make this your creative getaway located in the majestic Hawkesbury region.