The top suburbs where population growth is driving up property values
While demand for affordable housing is attracting more Australians to fringe suburbs, some are seeing value in regional tourist hotspots
 3 min
3 min
Australia’s population growth hot spots are mostly affordable property markets on the outskirts of major cities and in regional areas, according to an analysis by PropTrack. But homes may not remain affordable for long, with most of these areas recording above-average price growth over the past five years.
Australia’s population grew by 2.5 percent to 26.8 million people over the 12 months ending 30 September, according to the latest figures from the Australian Bureau of Statistics (ABS). This was an annual increase of 659,800 people, with migrants making up 83 percent of the increase.
REA economist Megan Lieu said home prices in Australia’s population growth hot spots are growing at an above-average pace due to strong buyer demand. However, median prices in the SA3 regions she analysed are still more affordable than their nearest capital cities or major regional cities.
Wyndham, on the western edge of Melbourne, recorded the strongest population growth over the past five years with almost 41,000 more people living there today compared to June 2018. In NSW, Blacktown–North in western Sydney had the highest growth with almost 36,000 new residents. In Queensland, Ormeau–Oxenford in the Gold Coast’s northern suburbs gained almost 28,000 new residents, with Ms Lieu noting it was a popular market with interstate and international migrants.
Ms Lieu said the worst housing affordability in three decades may be driving population growth in areas with lower median values.
“A potential factor contributing to this trend is that homes in a majority of these regions are generally priced lower than their broader greater capital city area (GCCSA),” Ms Lieu said. “This is evident when we look at the current median sale price of homes in these SA3s. Over 60 percent of them sold for less than the median in their respective city or regional area.”
Ms Lieu said other drivers of these areas’ strong population growth could be local councils zoning large swathes of land for home development.
“They tend to be in peripheries of cities where more new homes are being built relative to other areas. The increase in the supply of homes could be contributing to more competitive pricing.”
However, these competitive prices are attracting more demand than supply, leading to strong price growth. “All except four of the SA3 regions have experienced larger price growth in the past five years compared to their corresponding city or regional area,” Ms Lieu said.
The price growth differential is more than 20 percent in some regions, such as Rouse Hill-McGraths Hill in Sydney, Ormeau-Oxenford in Queensland and Fleurieu-Kangaroo Island in South Australia.
Median house prices have moved up dramatically in many of the individual suburbs within the SA3 population hot spots. For example, the median house price in the suburb of Ormeau on the Gold Coast in Queensland is $830,500, according to PropTrack data. It has risen 7.9 percent over the past 12 months and skyrocketed 68 percent over the past five years. The median house price in the suburb of Rouse Hill in north-west Sydney is $977,500, down 2.5 percent over the past year but up 30 percent over five years. The median price in the Melbourne outskirts suburb of Wyndham Vale is $585,000, up 2.5 percent over the past year and 26 percent over five years.
Another factor driving strong price growth may be the increasing lifestyle appeal of these particular areas over the past five years. For example, Ormeau is close to Westfield Coomera, which opened in 2018, and has benefitted from numerous M1 road upgrades between Brisbane and the Gold Coast. Rouse Hill has its own station on the Sydney Metro Northwest rail line, which began running in 2019.
Ms Lieu said it was likely that more Australians would seek cheaper homes in city outskirts areas and the regions as property values continue to grow amid a continued forecast housing undersupply.
“With supply unable to meet continued strong housing demand, home prices may experience further upward pressure,” Ms Lieu said.
Top 3 areas for highest population growth over 5 years
NSW
Blacktown–North, Sydney 36,233 (new residents since 2018)
Bringelly-Green Valley, Sydney 27,741
Rouse Hill-McGraths Hill, Sydney 21,821
VICTORIA
Wyndham, Melbourne 40,833
Melton-Bacchus Marsh, Melbourne 35,818
Casey-South, Melbourne 33,191
QUEENSLAND
Ormeau-Oxenford, Gold Coast 27,719
Brisbane Inner, Brisbane 16,465
Springfield-Redbank, Ipswich 15,326
SOUTH AUSTRALIA
Playford, Adelaide 6,997
Charles Sturt, Adelaide 6,410
Fleurieu-Kangaroo Island, regional South Australia 5,504
WESTERN AUSTRALIA
Swan, Perth 16,959
Wanneroo, Perth 14,885
Mandurah, regional Western Australia 11,156
TASMANIA
Hobart-North East, Hobart 2,723
Devonport, regional Tasmania 1,926
North East, Launceston-North East 1,728
Source: PropTrack, SA3 regions with highest population growth over 5 years

Victorian auction buyers will soon receive a piece of information that has traditionally been withheld until bidding reaches it: the vendor’s reserve price. Under new property-sale and underquoting laws, agents must publish the agreed reserve at least seven days before an auction or fixed-date sale. Most changes begin on 1 October 2026 and apply to …
Continue reading “Victoria’s New Auction Rules Will Force Reserve Prices Into the Open”
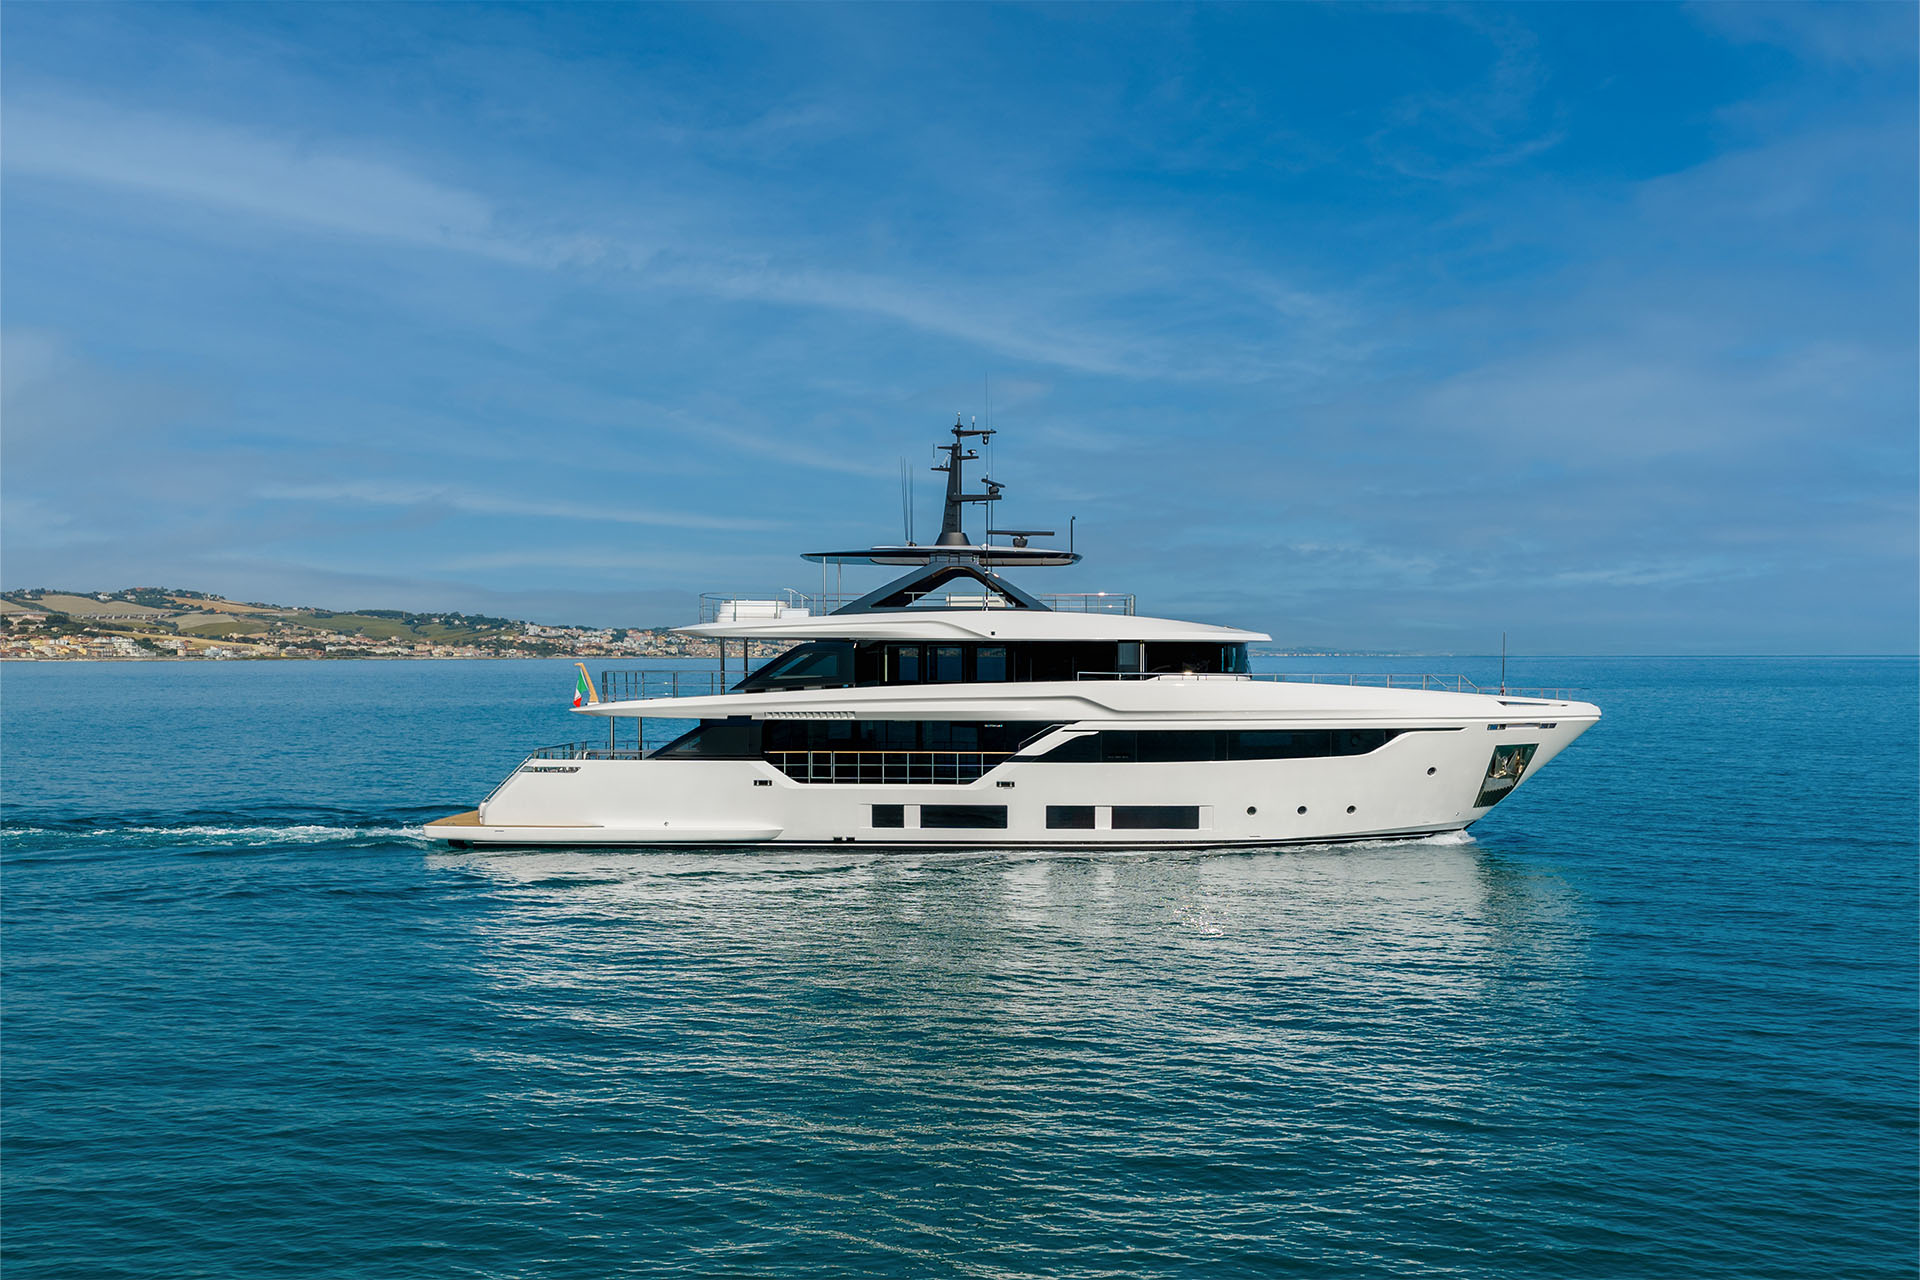
Four decks, 34.5 metres and a made-to-measure interior: step aboard the new Custom Line Navetta 35, unveiled at Cannes.
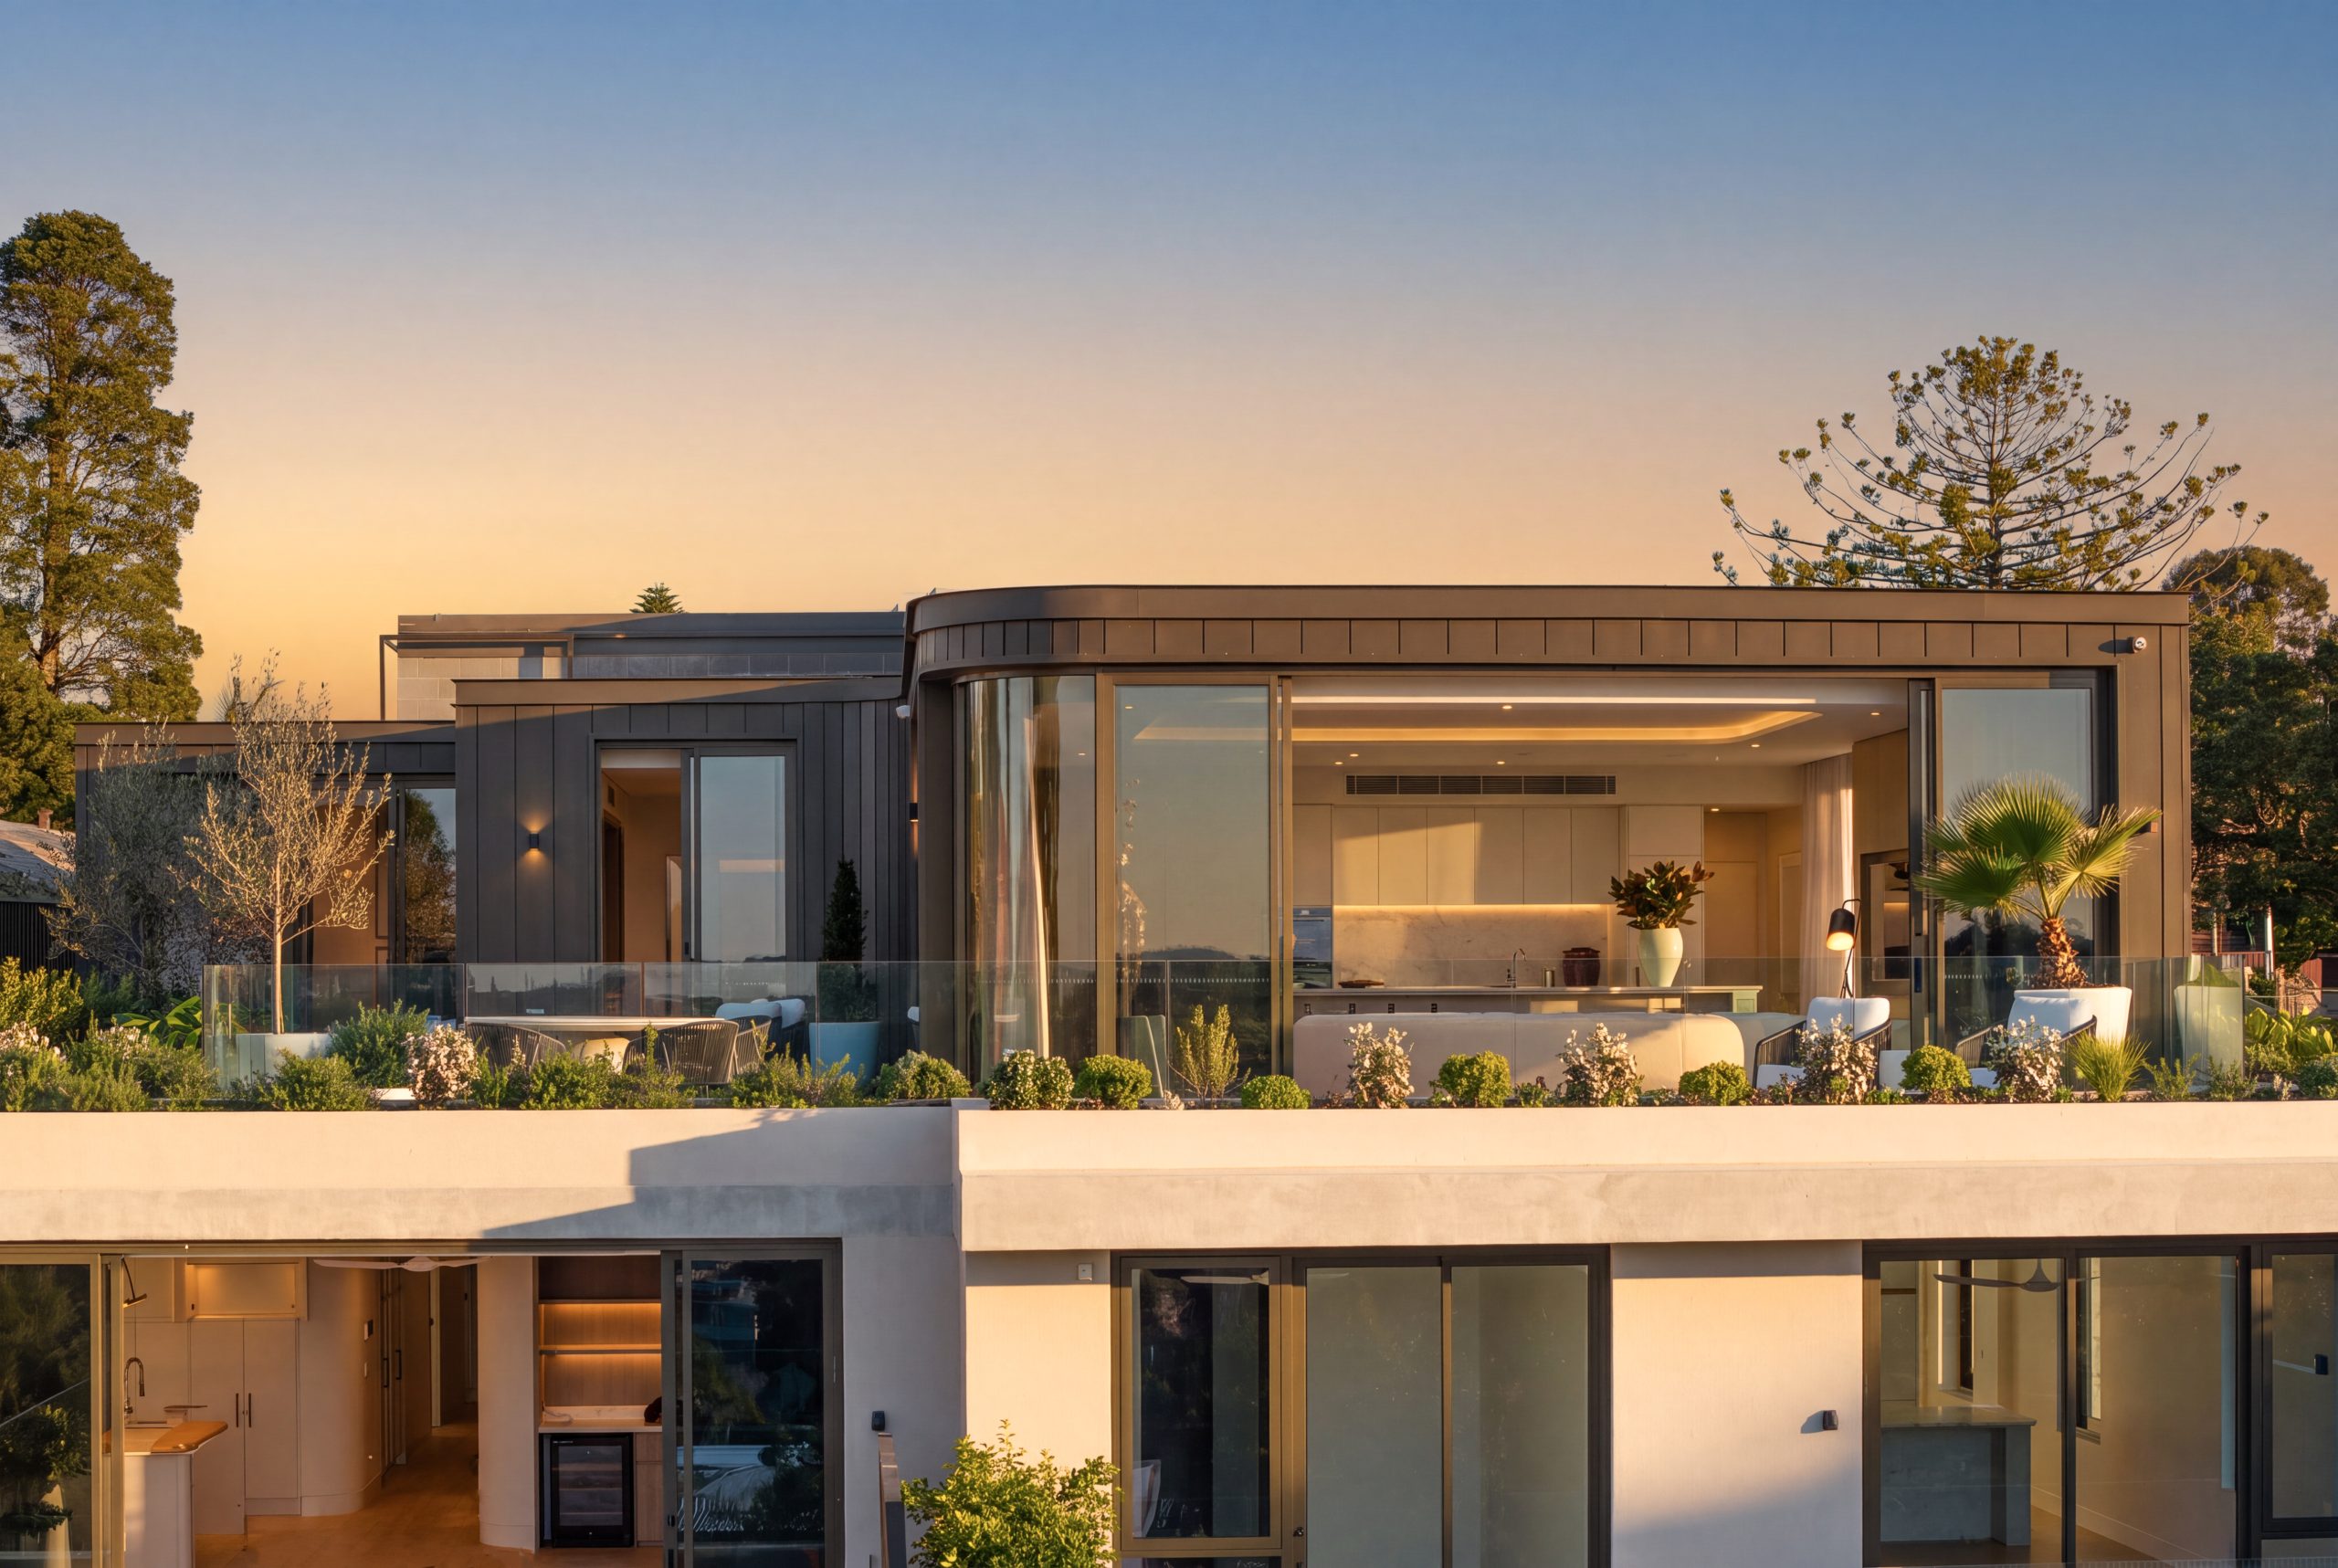
New detached-home sales fell 10% nationally in August, led by a 27% decline in Victoria, raising concerns about construction starts in 2027.
2 min
Australia’s hoped-for recovery in housing construction is losing momentum before it has had time to close the national supply gap.
Sales of new detached homes fell 10 per cent nationally in August, according to the Housing Industry Association’s survey of major volume builders across the five largest mainland states. It was the fourth consecutive monthly decline.
The fall was broad rather than isolated. Victoria recorded the largest retreat, down 27 per cent, followed by Queensland at 20.2 per cent, New South Wales at 17.5 per cent, South Australia at 10.8 per cent and Western Australia at 8.2 per cent.
Across the three months to August, sales were 19.3 per cent below the preceding three-month period and 7.7 per cent lower than the equivalent period a year earlier.
New-home sales matter beyond the immediate fortunes of volume builders. They are an early indicator of future starts: buyers sign contracts, finance is finalised, approvals are secured and construction follows months later. A sustained sales decline during the middle of 2026 is therefore likely to weaken commencements during 2027.
The slowdown reflects the collision of several pressures. Households have absorbed multiple interest-rate rises, reducing borrowing capacity and increasing the repayment cost attached to a new build. Established-home prices have softened in some markets, weakening the relative appeal of waiting through a construction period. Builders continue to face elevated labour and material costs.
The Reserve Bank’s August analysis showed new-dwelling construction prices increased 1.8 per cent during the June quarter and 5.3 per cent over the year. It attributed part of the pressure to oil-derived building products and other conflict-related costs.
Policy uncertainty can also cause buyers and investors to defer large commitments. But the precise contribution of any single tax or regulatory change is difficult to isolate from rates, confidence, land prices and construction costs. The HIA survey should be read as an indicator from large builders rather than a complete count of every dwelling sale.
The figures complicate progress towards the Housing Accord target of 1.2 million homes. The National Housing Supply and Affordability Council reported 308,000 completions since the Accord began and 244,000 dwellings under construction in the March quarter. Approvals and commencements had improved, but falling sales risk undermining the next wave.
For developers and governments, the warning is that planning approvals alone do not create homes. Projects need finance, viable construction pricing and buyers able to settle. If one part fails, approved supply can remain on paper.
Data box
National August new-home sales: Down 10 per cent
Three months to August: Down 19.3 per cent from the preceding three months
Year-on-year three-month comparison: Down 7.7 per cent
Victoria: Down 27 per cent
Queensland: Down 20.2 per cent
New South Wales: Down 17.5 per cent
South Australia: Down 10.8 per cent
Western Australia: Down 8.2 per cent

The pandemic-fuelled love affair with casual footwear is fading, with Bank of America warning the downturn shows no sign of easing.

Once a sleepy surf town, Noosa has become Australia’s prestige property hotspot, where multi-million dollar knockdowns, architectural showpieces and record-setting sales are the new normal.