Where property prices are rebounding around the country
Interest rate rises and cost of living pressures resulted in mixed results on home values around Australia
 3 min
3 min
Australian home prices rebounded strongly in 2023, new figures released today have shown.
The Home Value Index from property data provider CoreLogic revealed prices surged by 8.1 percent last year after falling -4.9 percent in 2022. However, recorded growth is nothing like the rises in 2021, which saw home prices swell by 24.5 percent.
CoreLogic research director Tim Lawless said while the greatest increases were seen at the start of 2023, consistent interest rate rises announced by the RBA put a dampener on growth as the year progressed, with just a 0.4 percent increase in December.
“This was the smallest gain in our national monthly HVI since values started rising in February,” Mr Lawless said. “After monthly growth in home values peaked in May at 1.3 percent, a rate hike in June and another in November, along with persistent cost of living pressures, worsening affordability challenges, rising advertised stock levels and low consumer sentiment, have progressively taken some heat out of the market through the second half of the year.”
While regional areas saw record price rises during COVID, it is now the Australian capitals leading increases in home values, Mr Lawless said.
“Stronger conditions across capital city markets is a reversal of the early COVID trend which saw regional markets experience higher demand amid strong internal migration,” he said. “Regional migration trends have mostly normalised through 2023, and the significant capital gains recorded through 2020 to 2022 has meant many regional markets have become less affordable.”
However, growth across capital cities is uneven, with Perth recording the highest annual increases at 15.2 percent, followed by Brisbane on 13.1 percent and Sydney on 11.1 percent. The results were followed by Adelaide (8.8 percent), Melbourne (3.5 percent) and Canberra (0.5 percent). Darwin and Hobart values declined over the past 12 months, down -0.1 percent and -0.8 percent respectively.
In Perth, the top performing suburb was Armadale, up 25.2 percent, followed by Gosnells, 22.6 percent.
In Brisbane, home values in the suburb of Nathan are up 22 percent on last year, followed by Mt Gravatt, up 21.1 percent.
For the Sydney market, Blacktown lead the way, with a 15.8 percent increase in home values, followed by the inner west suburbs of Marrickville – Sydenham – Petersham, which increased by 15.3 percent.
|
Rank |
SA3 Name |
SA4 Name |
Median Value |
Annual change |
|
Greater Sydney |
||||
|
1 |
Blacktown |
Sydney -Blacktown |
$969,287 |
15.8% |
|
2 |
Marrickville -Sydenham -Petersham |
Sydney -City and Inner South |
$1,741,931 |
15.3% |
|
3 |
Hornsby |
Sydney -North Sydney and Hornsby |
$1,485,422 |
15.3% |
|
4 |
Strathfield -Burwood -Ashfield |
Sydney -Inner West |
$917,641 |
14.9% |
|
5 |
Eastern Suburbs -North |
Sydney -Eastern Suburbs |
$1,988,175 |
14.6% |
|
6 |
Warringah |
Sydney -Northern Beaches |
$2,068,585 |
14.5% |
|
7 |
Canterbury |
Sydney -Inner South West |
$1,085,111 |
14.3% |
|
8 |
Mount Druitt |
Sydney -Blacktown |
$812,868 |
14.1% |
|
9 |
Merrylands -Guildford |
Sydney -Parramatta |
$1,060,399 |
14.1% |
|
10 |
Leichhardt |
Sydney -Inner West |
$2,007,850 |
14.0% |
|
Greater Melbourne |
||||
|
1 |
Darebin -North |
Melbourne -North East |
$762,619 |
7.9% |
|
2 |
Banyule |
Melbourne -North East |
$935,214 |
7.7% |
|
3 |
Monash |
Melbourne -South East |
$1,223,086 |
7.6% |
|
4 |
Knox |
Melbourne -Outer East |
$910,533 |
7.5% |
|
5 |
Manningham -West |
Melbourne -Inner East |
$1,388,013 |
7.1% |
|
6 |
Manningham -East |
Melbourne -Outer East |
$1,539,018 |
6.9% |
|
7 |
Whitehorse -West |
Melbourne -Inner East |
$1,213,085 |
6.7% |
|
8 |
Whitehorse -East |
Melbourne -Outer East |
$1,185,513 |
6.1% |
|
9 |
Casey -North |
Melbourne -South East |
$808,703 |
5.3% |
|
10 |
Casey -South |
Melbourne -South East |
$758,745 |
5.1% |
|
Greater Brisbane |
||||
|
1 |
Nathan |
Brisbane -South |
$1,079,497 |
22.0% |
|
2 |
Mt Gravatt |
Brisbane -South |
$1,117,075 |
21.2% |
|
3 |
Sunnybank |
Brisbane -South |
$1,026,758 |
19.4% |
|
4 |
Carindale |
Brisbane -South |
$1,212,544 |
19.1% |
|
5 |
Holland Park -Yeronga |
Brisbane -South |
$756,166 |
18.8% |
|
6 |
Springwood -Kingston |
Logan -Beaudesert |
$638,552 |
17.1% |
|
7 |
Chermside |
Brisbane -North |
$945,095 |
16.7% |
|
8 |
Rocklea -Acacia Ridge |
Brisbane -South |
$935,200 |
16.2% |
|
9 |
Nundah |
Brisbane -North |
$794,173 |
15.7% |
|
10 |
Forest Lake -Oxley |
Ipswich |
$665,472 |
15.4% |
|
Greater Adelaide |
||||
|
1 |
Playford |
Adelaide -North |
$474,782 |
14.3% |
|
2 |
Gawler -Two Wells |
Adelaide -North |
$590,250 |
13.7% |
|
3 |
Salisbury |
Adelaide -North |
$582,159 |
13.2% |
|
4 |
Tea Tree Gully |
Adelaide -North |
$700,396 |
11.5% |
|
5 |
Port Adelaide -West |
Adelaide -West |
$691,116 |
11.0% |
|
6 |
Onkaparinga |
Adelaide -South |
$663,042 |
9.9% |
|
7 |
Port Adelaide -East |
Adelaide -North |
$737,926 |
8.5% |
|
8 |
Marion |
Adelaide -South |
$797,606 |
8.3% |
|
9 |
Campbelltown |
Adelaide -Central and Hills |
$859,213 |
8.2% |
|
10 |
Burnside |
Adelaide -Central and Hills |
$1,416,110 |
8.2% |
Top 10 capital cities SA3s with the highest 12-month value growth – Dwellings. Source: CoreLogic

Set on one of the city’s last absolute riverfront sites, The Riversdale by Mosaic combines irreplaceable waterfront ownership with one of Brisbane’s most significant residential opportunities.
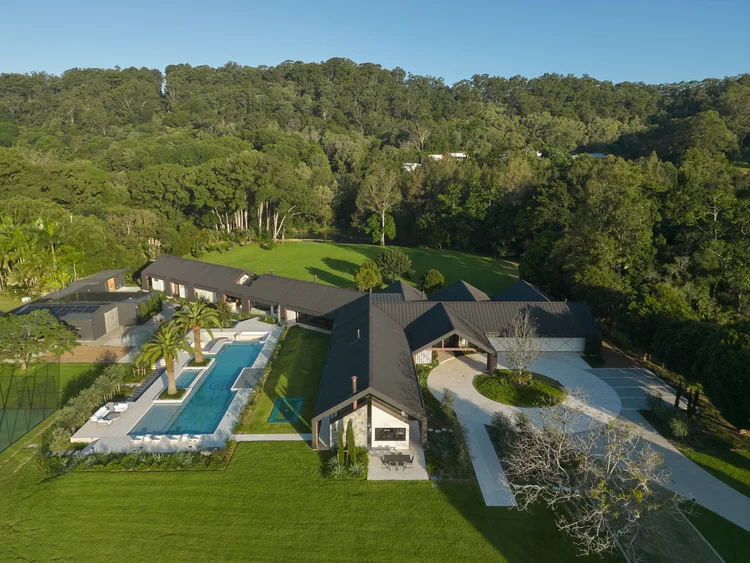
Margot Robbie may have travelled from a Queensland farm to the highest reaches of Hollywood, but a reported $28 million property deal suggests the Gold Coast has never lost its hold on her. The Australian actor and producer is believed to be the mystery buyer of Redwood, a seven-acre Currumbin Valley estate transformed into the …
Continue reading “Margot Robbie Reportedly Behind $28 Million Currumbin Valley Homecoming”

Artificial intelligence is making it easier than ever to build a business without building a team. As AI takes over coding, customer support, marketing, administration, and other day-to-day tasks, a growing number of solo founders are scaling startups to millions in revenue with few—or even no—employees. While the trend is lowering barriers to entrepreneurship, it is also reshaping hiring, raising questions about the future of work and how businesses will grow in the AI era.
5 min
Ben Broca launched a company last December that offers AI tools to entrepreneurs. He’s already added 10,000 paying customers and is on track to bring in $10 million in revenue this year.
One thing he hasn’t added: any other employees.
The 40-year-old is part of a class of entrepreneurs who are launching, and then often running, new companies on their own. Artificial intelligence tools answer Broca’s emails, help write and debug code, field requests from customers, sign up new subscribers and grant refunds when issues arise.
Broca relishes his ability to make whatever decisions he wants on his own, often from his sun-drenched Sausalito, Calif., living room. “I think compromises make lukewarm results,” he said.
Once upon a time, running a business of a certain size required a team. AI is turning that assumption upside down, and more aspiring entrepreneurs are going it alone.
An analysis by the payments company Stripe shows there are thousands of solo operators on the company’s platform that are generating over $1 million in revenue, with their ranks doubling between 2023 and 2025. The number of solo operators crossing the $10 million threshold nearly tripled in that same span.
In the past, people without business contacts or particular savvy might not have known how to get their ideas off the ground, said Ernie Tedeschi, Stripe’s chief economist. “Now, AI can be a built-in business partner,” he said.
AI’s ability to handle various administrative tasks makes it potentially useful for launching solo businesses in many fields. But the technology’s ability to also handle key tasks in tech, like coding, make that field a particular hot spot.
Analyzing Census Bureau data, Bank of America Institute economist Taylor Bowley found that among all industries, new business applications in the information sector have seen the biggest percentage increase—nearly 45%—over the past year. At the same time, the rate of information-sector applicants saying they plan to hire workers has experienced the sharpest decline of any measured industry.
This Census dataset doesn’t track solo-operated businesses. But the numbers broadly show—in tech and beyond—that applications are flat among businesses likely to hire workers, but generally rising elsewhere. Economists say that’s a strong sign that solo operators are on the upswing.
“The bar for getting started has never been lower,” said Julian Weisser, who runs a San Francisco-based accelerator for solo founders working in tech. The accelerator—which offers founders seed money and mentorship in exchange for an equity stake—attracted 4,500 applicants for 10 slots made available in its most recent cycle, nearly five times the number it drew when it launched last May.
Going it alone with AI can still be surprisingly expensive. Broca said he was losing money on many customers’ accounts while paying to access Anthropic’s Claude to run his clients’ requests—that AI company, as well as others, charges based on usage. He has since switched to free open-source AI models from China.
Broca said he has raised $30 million from investors and, at the same time, has saved millions in salary since he hasn’t needed a team of software engineers.
Another risk: If it’s easy for one entrepreneur to launch an AI-assisted business, copying them can be easy, too. This creates anxiety for founders like Troy Johnston, who runs an AI-assisted business alone in Orlando, Fla.
“Everybody has the sword and we all have the ability to unsheathe Excalibur now,” said Johnston, 40, who used AI to code an app that helps people get the most out of credit card benefits. The company makes around $3,000 a month in profit, with no employees, and is continuing to grow.
What one-person businesses will mean for the labor market remains to be seen. Polling has shown Americans are worried that AI will replace jobs, and top economists are wrestling with that possibility, too. But AI is also creating lots of new jobs, and the go-it-alone entrepreneurs show how the technology can both open doors and limit employment opportunities.
“If everyone’s hiring less, but you get four times more firms, what does that do to head count?” said Rembrand Koning, an associate professor at Harvard Business School who studies entrepreneurship. He co-authored a recent study that found that among 50,000 startups the researchers examined, those focused on AI tended to operate with 25% fewer employees.
Koning also believes a soft hiring environment that’s left some people mired in long job searches has encouraged more to try their hand at launching businesses.
Some founders cite different motives. “It’s a perfect storm of post-pandemic burnout and a re-evaluation of one’s priorities, and also booming AI and a sense of what’s possible,” said Samir Ahmad, 39, who lives in Breinigsville, Pa.
Two years ago, Ahmad decided to leave the corporate job he had worked at Verizon for almost two decades to start a solo coaching and consulting business. He had been seeing social-media posts touting the ease and virtues of AI, which he used to chart a business plan and help with marketing. “It was like my chief of staff, a second in command,” he said.
The business ultimately petered out within months, though, and Ahmad is now back to a full-time corporate role with a utility company.
For Claire Vo, 41, AI helped her turn a passing impulse into a business. She was working full-time as a tech executive when she tapped AI in late 2023 to help code an app that would help her manage documentation and design for new products, with customers ranging from financial services to healthcare firms.
“I was copying and pasting from ChatGPT,” said Vo, who lives in San Francisco.
She put the app online for $1 a month, and within weeks people downloaded it thousands of times. Nearly three years later, Vo’s company—which she ran solo for nine months before hiring an engineer—now has 100,000 users and is on track to make seven figures in profit this year. AI handles the company’s marketing, sales and customer support.
While AI is a shortcut, Vo said her network and credibility in the industry were key. “I think people over-index on how easy AI is and under-index on how much I did to get to this point,” she said.

The era of the gorgeous golden retriever is over. Today’s most coveted pooches have frightful faces bred to tug at our hearts.

Margot Robbie and Jacob Elordi star in an adaptation of the classic novel that respects the romance’s slow burn.