

Heat coming out of V-shaped property market recovery
Sydney and Melbourne are cooling but Perth, Brisbane and Adelaide are still rocketing, according to new price data
 2 min
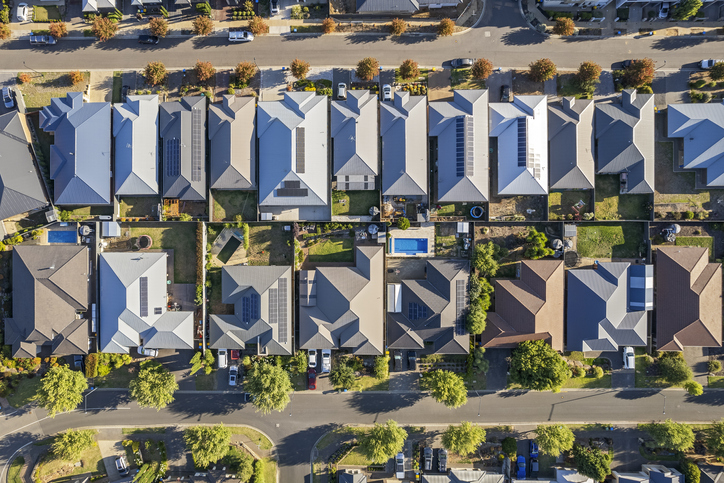
The V-shaped recovery in Australia’s property market was interrupted in November, with CoreLogic’s national home value index recording its smallest monthly gain since the new growth cycle began in February. Melbourne home values dipped by 0.1% and Sydney’s growth rate slowed sharply to 0.3%, representing a significant cooling in Australia’s two biggest property markets, and dragging down the national home value growth rate to 0.6%.
Factors taking the heat out of Melbourne and Sydney include affordability constraints, rising interest rates, pessimistic consumer sentiment and a higher number of homes for sale. CoreLogic Research Director Tim Lawless said market weakness was more pronounced in the upper price brackets. “The more expensive end of the market tends to lead the cycles in these cities. As borrowing capacity reduces, we may be seeing more demand deflected towards lower housing price points, with the broad middle of the market now recording the strongest rate of growth in Sydney and Melbourne.”
Meantime, the Perth, Brisbane and Adelaide markets continue to rise strongly. Perth dwelling values surged by 1.9% in November – the largest monthly gain since March 2021 – while Brisbane moved 1.3% higher and Adelaide went up 1.2%. Mr Lawless said buyer demand was strong amid low levels of supply. “This imbalance between available supply and demonstrated demand is keeping strong upwards pressure on housing values across these markets, despite the downside factors leading to weaker housing market conditions across the lower eastern seaboard,” Mr Lawless said.
Canberra recorded subdued growth at 0.5%, Hobart values fell 0.1% and Darwin values fell 0.3% last month. The supply of homes for sale began increasing over winter, which is seasonally unusual, leading to stock levels above five-year averages in Hobart, Canberra, Melbourne and Sydney today.“In these cities, market conditions are now in favour of buyers as higher stock levels provide more choice, less urgency and greater opportunities to negotiate,” Mr Lawless said.
“The same can’t be said for Perth, Brisbane and Adelaide, where advertised stock levels remain remarkably low. Perth listings are nearly 40% below their five-year average for this time of the year, while listings are more than 30% below average in Brisbane and Adelaide. Unsurprisingly, these cities are continuing to show a consistently high rate of growth amid strong selling conditions.”
Perth, Brisbane and Sydney have been the strongest performing capital city markets of 2023 with home values up 13.6%, 11.9% and 11.3%, respectively. Regional markets have lagged behind the capital cities this year, with the strongest gains seen in regional South Australia, up 9.6%, regional Queensland, up 7.9% and regional Western Australia, up 7%. Overall, regional property prices remain 1.8% below their historical peak recorded at the top of the last cycle in May 2022.
Mr Lawless said it would be “a very different housing market” in 2024. “It is looking increasingly clear the housing market is moving through a new inflection point, with the rate of growth in home values becoming more diverse, but generally weakening,” he said. The prospect of higher interest rates for longer has likely dampened buyer confidence as well. “We don’t expect to see a material lift in housing activity until interest rates reduce, and that isn’t likely until the second half of next year.”
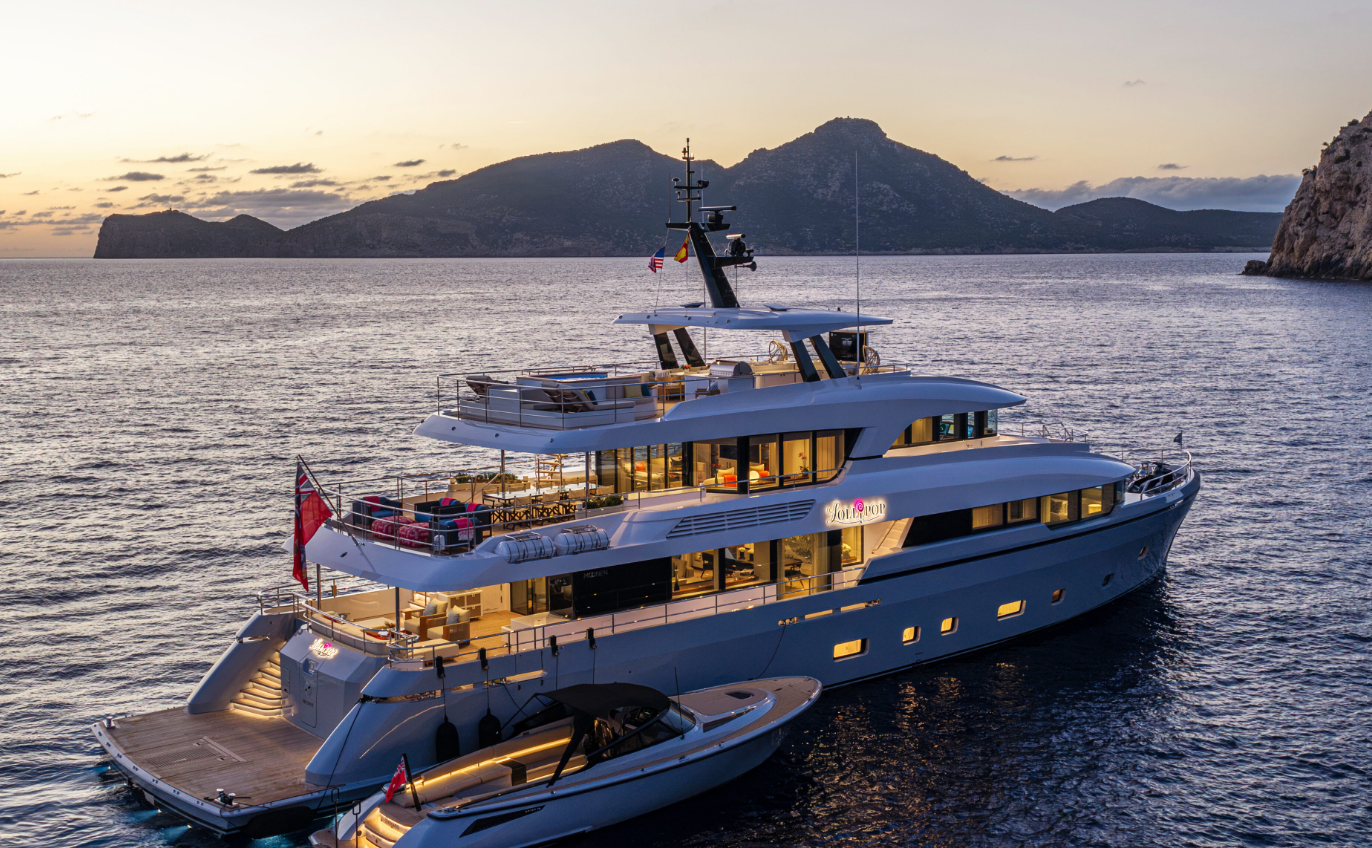
Dutch studio Vripack took cues from a Shirley Temple song for Lollipop, a 37.4-metre Moonen superyacht built for long-range cruising.
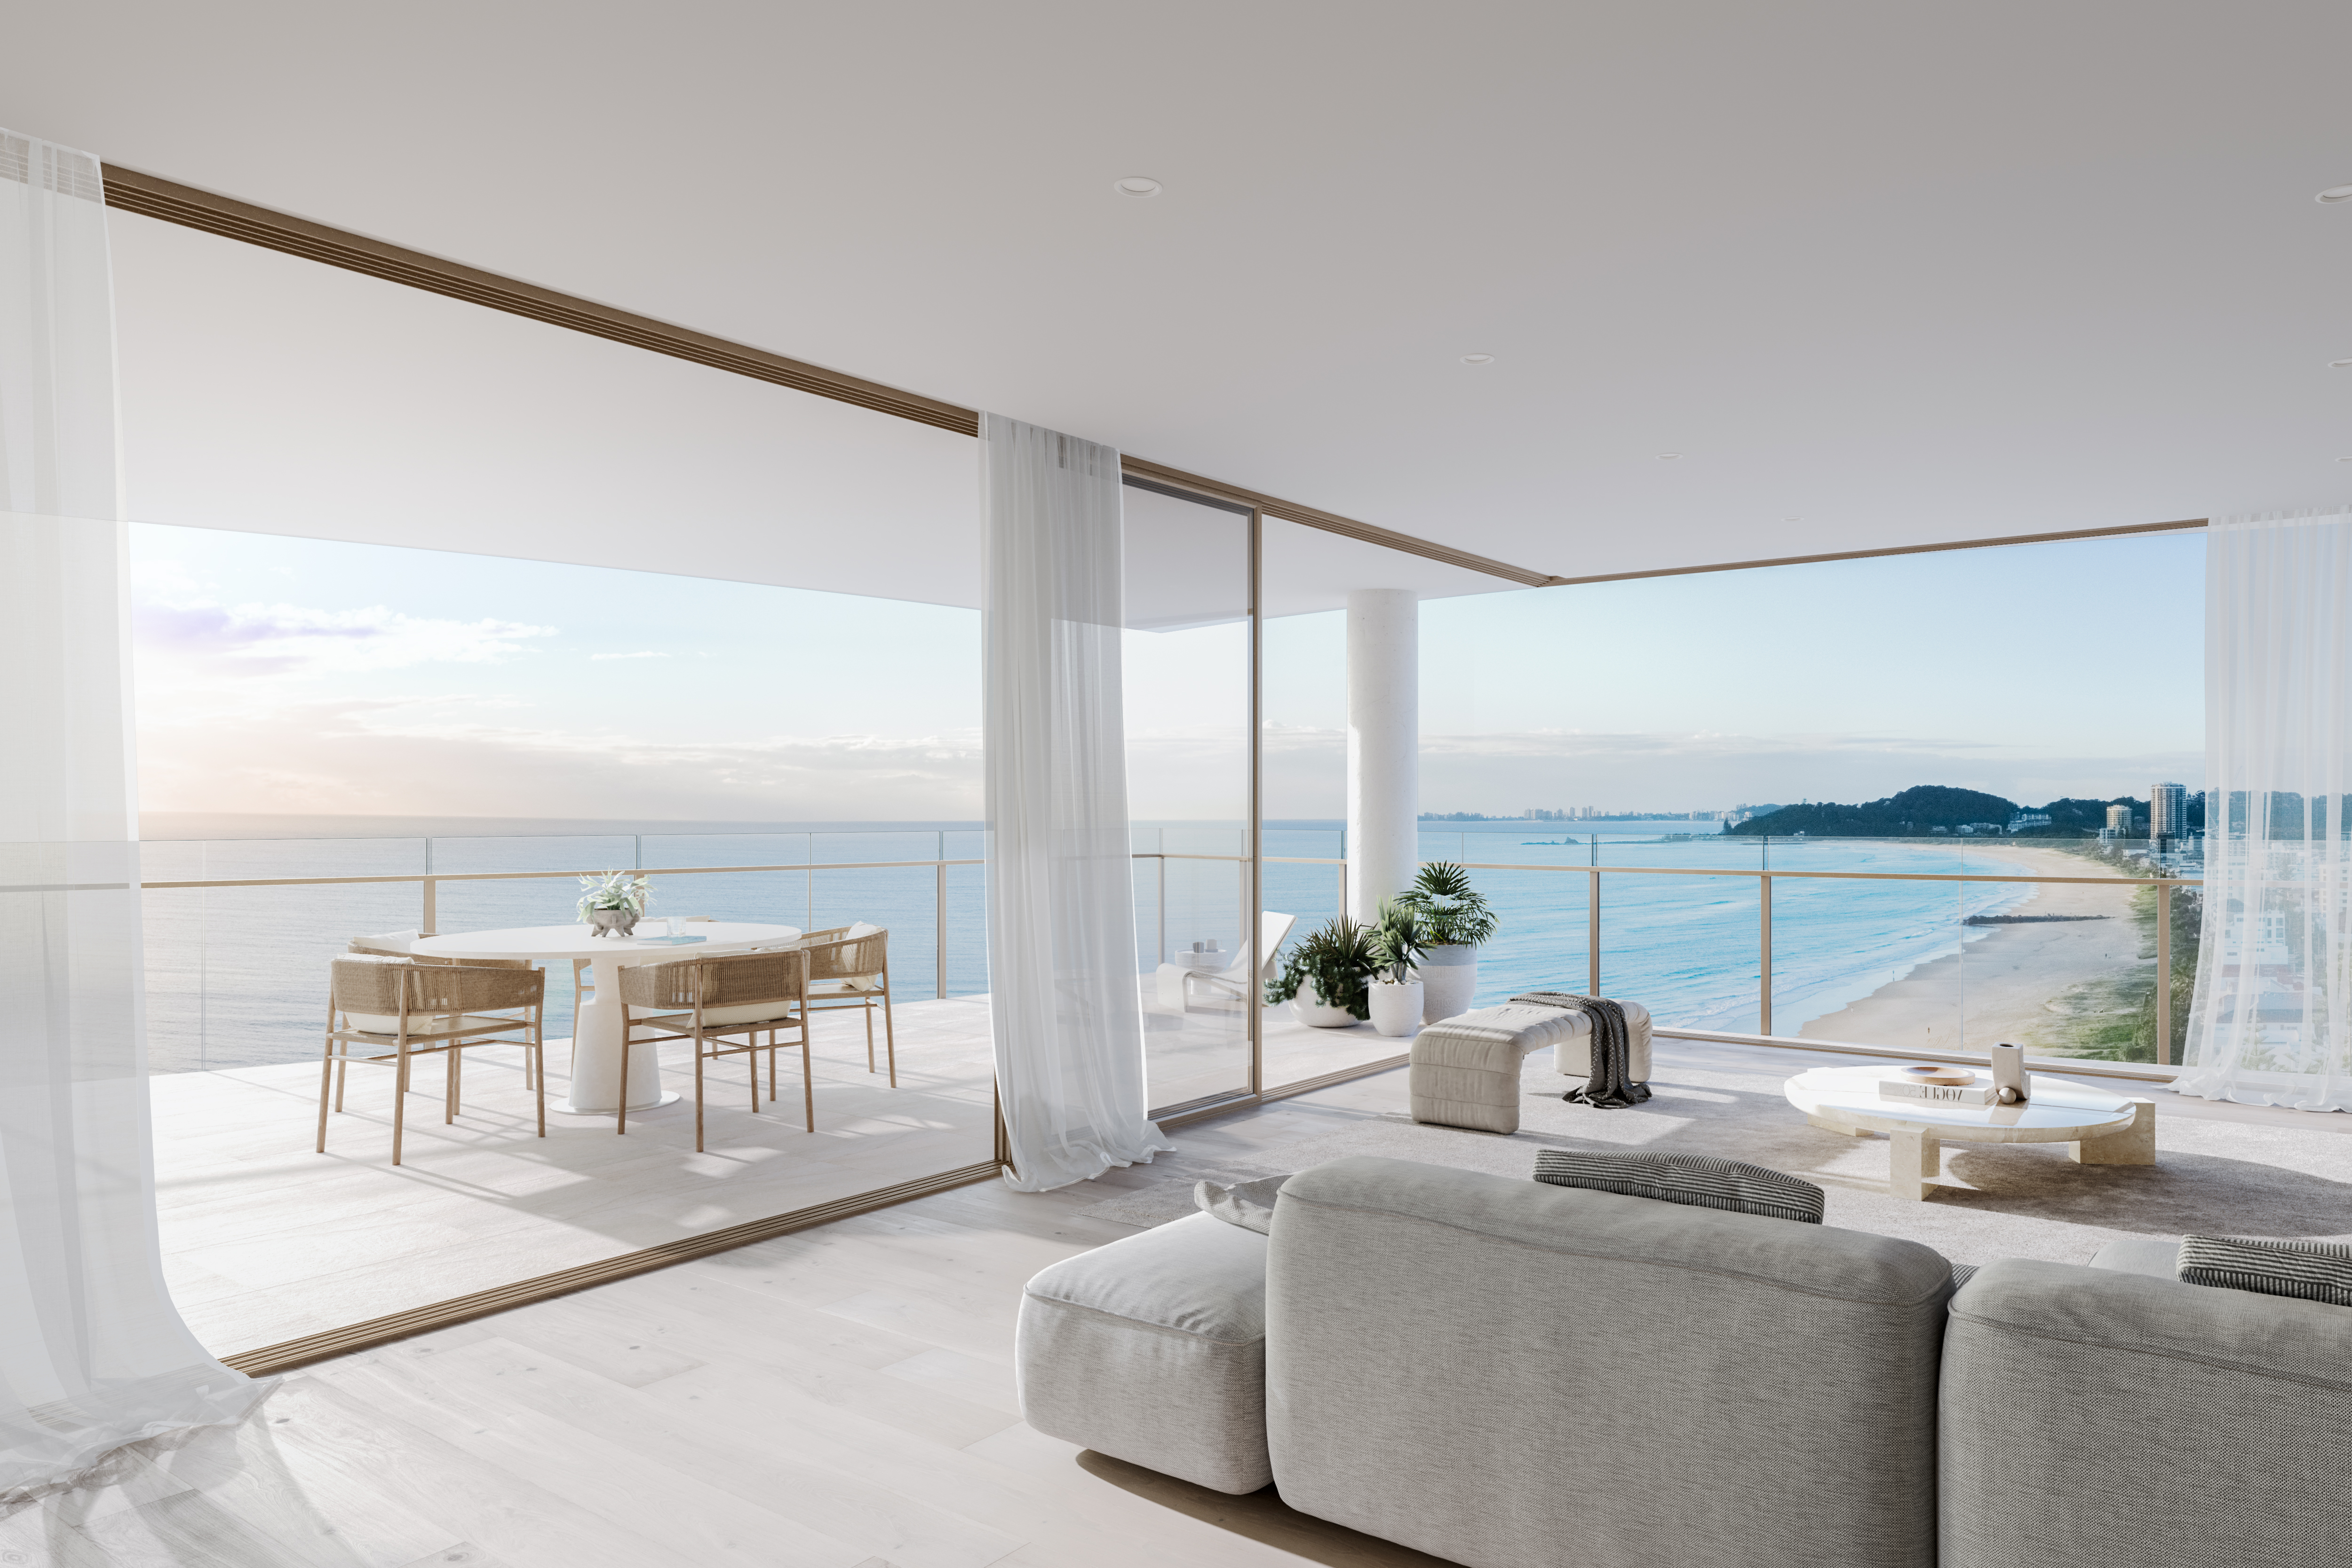
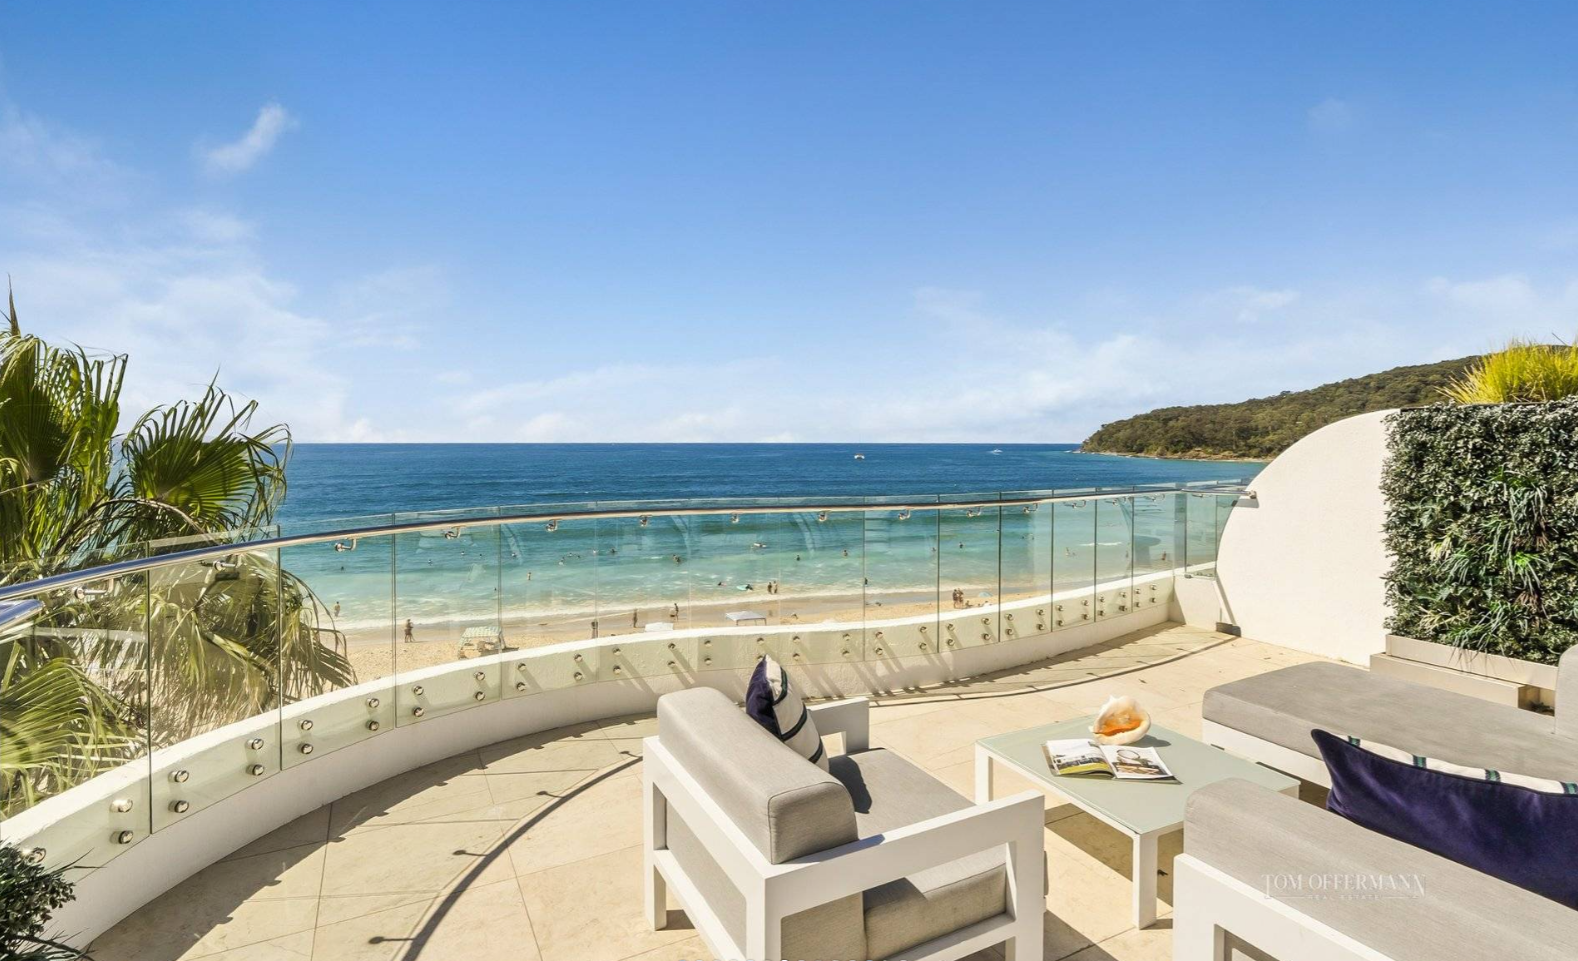
A Sydney couple has paid $15.5 million for the Grand Penthouse at Marquee’s $285 million La Belle Residences beachfront development which is nearing completion at Palm Beach, eclipsing the record for an off-the-plan apartment sale on the southern Gold Coast. The sprawling single level 640 sqm beachfront residence, with sweeping views of the Gold Coast …
Continue reading “$15.5m La Belle Penthouse eclipses southern Gold Coast record”
 2 min
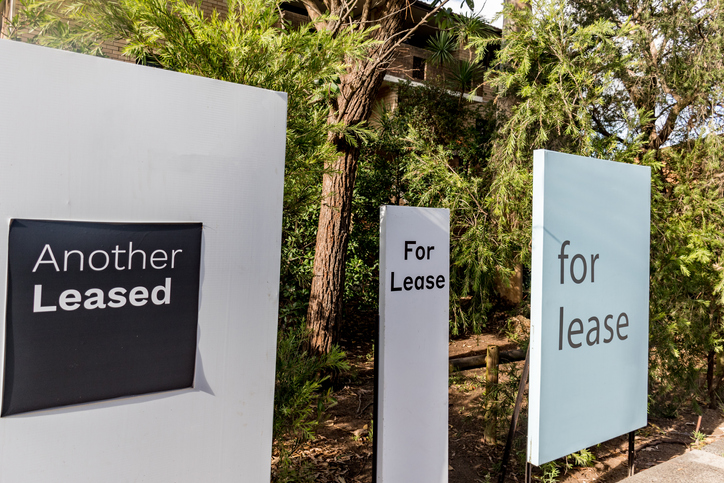
Sydney had roughly 4,300 more vacant rentals in October than it did a year earlier, giving tenants a wider pool of properties to inspect. SQM Research counted 13,872 vacancies in the city, up about 45 per cent on October 2025. The vacancy rate held at 1.8 per cent, compared with 1.3 per cent a year earlier.
Melbourne’s vacancy rate rose to 2 per cent, the highest of any capital, with 10,833 properties available. Together, Sydney and Melbourne accounted for more than half the 44,275 vacancies SQM recorded nationally. The national rate edged up to 1.5 per cent, from 1.4 per cent in September and 1.2 per cent a year earlier. SQM’s measure counts online rental listings that have been advertised for at least three weeks.
That three-week threshold matters. A rental let quickly can come and go without entering the count. A bigger pool of listings that have been advertised for at least three weeks suggests more properties are taking longer to lease. SQM noted that Melbourne’s rise in vacancies came as asking rents softened across houses and units during spring, when rents would usually pick up.
Sydney’s house and unit rents are moving in different directions
Sydney unit asking rents fell 0.7 per cent over the 30 days to 12 November, to about $744 a week. House asking rents rose 1.6 per cent to about $1,175. In Melbourne, both fell for a second consecutive month, with units down 1.6 per cent and houses down 0.4 per cent. Melbourne’s combined asking rent was still 5.7 per cent higher than a year earlier.
The Sydney figures put the weekly gap between house and unit asking rents at about $431. The averages cover different properties across the city, but the size of the gap helps explain why a household looking for an extra bedroom or outdoor space may experience a tighter market than someone looking for a unit.
Smaller capitals are still tight
Perth and Adelaide both recorded vacancy rates of 0.6 per cent, while Hobart had the lowest capital-city rate at 0.4 per cent. Brisbane moved up to 1 per cent, the same as a year earlier, and its combined asking rents were still 7.1 per cent higher over the year. Canberra, at 1.9 per cent, was closer to Melbourne and Sydney on availability. Darwin recorded a monthly fall in advertised rents, yet annual growth there was still 11.8 per cent.
A separate Cotality review puts the recent easing in perspective. Its national series recorded rental growth of 0.5 per cent in the September quarter, down from 1.6 per cent in June and 2.1 per cent in March. Even after that slowdown, Cotality estimated national unit rents were $208 a week higher than five years earlier, while house rents had risen $195 a week.
On SQM’s measure, national advertised rents were still 6.4 per cent higher than a year ago. The clearest signs of relief are in Melbourne and in Sydney’s apartment market, where asking rents have eased as more rentals have become available. For renters looking for a detached house in Sydney, the latest figures still point to rising asking prices.

Warmer minimalism, tactile materials and wellness focused layouts are redefining luxury interiors as homeowners design for comfort, connection and lasting appeal.

Technology and semiconductor shares fell sharply as investors questioned the debt financing the AI infrastructure boom and confronted higher rates and Chinese competition.