


Hong Kong’s Property Market Is a Mess—and the Fed Is Partly to Blame
U.S. rate increases have tamed inflation at home but caused pain elsewhere

 4 min
4 min
Hong Kong’s notoriously expensive property market is often seen as a barometer of the city’s economy. It isn’t looking good.
Home prices are down. Office vacancy rates have hit a record high. Commercial real-estate investment has plummeted. The shares of some big developers in the city are trading at a 30-year low to their net asset value, a measure of financial health, according to research by analysts at JPMorgan.
A key reason is high interest rates, which have increased the burden on mortgage-paying home buyers, said Cathie Chung, senior director of research at Jones Lang LaSalle, a real-estate services company. The Hong Kong dollar’s peg to the U.S. dollar forces monetary authorities in the city to track U.S. interest-rate decisions, limiting their ability to stimulate the property sector and the wider economy.
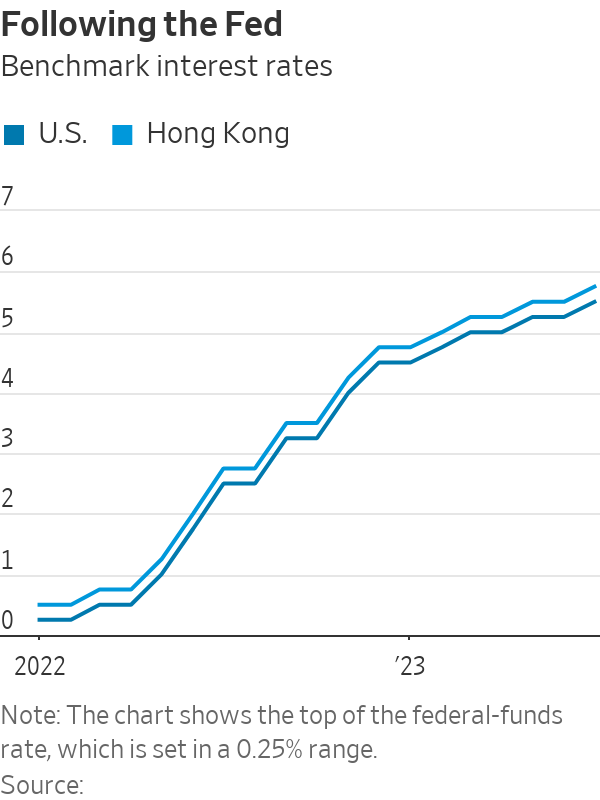
The Federal Reserve has embarked on a historic cycle of interest-rate rises since last March, raising the benchmark federal-funds rate from around zero to 5.25% to 5.50%. The Hong Kong Monetary Authority, the city’s de facto central bank, has followed these hikes, increasing its base rate to 5.75% from 0.75% over the same period.
The full impact of higher interest rates in the city still hasn’t been felt, said Asif Ghafoor, chief executive of online real-estate marketplace Spacious. Asking prices of residential properties listed on the platform have fallen 5% since the start of the year. Sales prices tend to follow suit, and are likely to fall 5% to 10% in the next six months, he said.
To prop up the market, the HKMA relaxed mortgage rules in early July for the first time since 2009, allowing home buyers to pay less upfront and borrow more for some properties if they plan to live in them. But those working in the sector think the pain is far from over.
“We expect that the recovery will be slow and long,” said Chung at Jones Lang LaSalle.
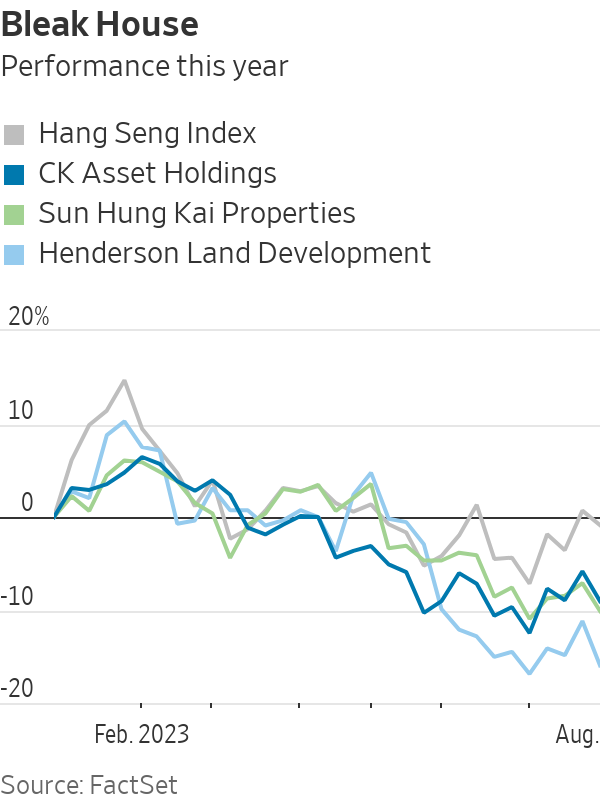
The slump in the property market has hurt the share prices of developers, a major source of wealth for some of the city’s richest families. CK Asset Holdings, Henderson Land Development, Sun Hung Kai Properties and New World Development—all still partly owned by the families of the founders—are performing much worse than the wider stock market this year. New World and Henderson Land have lost more than 15% this year, according to FactSet data.
Hong Kong is one of the world’s leading financial centres and is seen by many foreign businesses as a gateway to mainland China. It is now being hit by a slowdown in investment-banking activity—with several large banks cutting staff this year—and the shaky recovery of China’s economy, which has undermined confidence among businesses and potential home buyers in Hong Kong.
The overall vacancy rate for offices reached a record high of 15.7% in the first half of this year, compared with an average of under 5% in 2018, according to figures by CBRE. In the central business district, there was almost eight times as much empty office space as in 2018, when the area had a vacancy rate of just 1.3%.
The equivalent of $603 million was invested in commercial real estate between April and June, according to CBRE data, just a third of the first-quarter tally and the lowest quarterly figure since the end of 2008, when the global financial crisis caused a huge drop in confidence.
Hong Kong’s border with mainland China was reopened earlier this year, but companies from the mainland haven’t grabbed office space in the numbers many had hoped, said Ada Fung, head of office services at CBRE Hong Kong. Flexible working arrangements and geopolitical tensions that have made many companies pause expansion plans are also crimping demand, she said.
The drop in demand is being exacerbated by a supply glut. Developers bought land and started constructing a number of new buildings before 2019, when widespread protests rocked the city and only ended with the passing of a strict national-security law. Demand for commercial property after that was soon undermined by the spread of Covid-19.
This shift in supply and demand is finally giving potential renters the upper hand, said Fung. “It could be a healthy reset,” she said.
There are some reasons for optimism. Retail businesses have increased their demand for commercial property after the reopening of the border with China, which has brought in tourists looking to spend on luxury goods. There is also hope that a recent rise in residential rents could help home prices.
After an exodus of professionals and other residents in recent years, people have started to move to the city, including foreign students and those coming to Hong Kong through government talent schemes designed to reverse a brain drain. That is helping rents pick up after hitting a bottom in the first quarter, and could lead to more demand for properties as investments, said Cusson Leung, head of property research in Hong Kong at JPMorgan.
 Copyright 2020, Dow Jones & Company, Inc. All Rights Reserved Worldwide. LEARN MORE


Travellers are swapping traditional sightseeing for immersive experiences, with Africa emerging as a must-visit destination.

Wealthy Aussies are swapping large family homes for high-end apartments, with sales of prestige units tripling over the past decade.

Strong population growth, major infrastructure spending and comparatively affordable property are expected to cement Melbourne’s position as Australia’s most attractive long-term real estate market.
2 min
Melbourne is poised to become Australia’s largest city within the next decade, with strong population growth, infrastructure investment and relative affordability driving long-term property demand.
A new research report from Knight Frank argues the Victorian capital remains one of the country’s most compelling markets for investors, businesses and residents.
The report highlights the city’s rapidly expanding population, diverse economy and major infrastructure pipeline as key factors underpinning future property growth.
Knight Frank Managing Director Victoria, Dominic Long, said Melbourne’s fundamentals continue to position the city strongly for long-term investment.
“Melbourne continues to stand out as one of Australia’s most compelling real estate markets,” he said.
“It is Australia’s strongest long-term growth city with the fastest growing population, the most diversified economy, world-class liveability and the most affordable major market for office, industrial and residential property.”
Population growth driving demand
Melbourne’s population has grown at an average rate of 1.8 per cent per year since 2000, faster than any advanced global economy, according to the research.
In the year to June 2025 alone, the city added about 123,500 residents, the largest annual increase of any Australian capital.
Population growth is expected to remain one of the key drivers of demand across residential and commercial property markets, including housing, offices and logistics space.
The report forecasts Melbourne’s population will overtake Sydney’s by the 2030s, reinforcing its position as the country’s fastest-growing major city.
Office market offering value
Melbourne’s CBD office market is also attracting renewed attention from investors.
Prime office rents remain significantly lower than in competing cities, with CBD office space about 46 per cent cheaper than Sydney and around 13 per cent cheaper than Brisbane.
That relative affordability is expected to drive long-term demand from occupiers and investors seeking value in Australia’s largest office markets.
The city’s office sector is also showing signs of recovery, with effective rents rising in 2025 and demand increasing for high-quality buildings in premium locations.
Industrial market benefiting from scale
Melbourne’s industrial sector continues to expand, supported by strong population growth, e-commerce demand and the scale of the city’s logistics network.
The city already hosts the country’s largest industrial market, with about 34 million square metres of warehousing stock and significant land available for future development.
Industrial rents remain competitive compared with other capitals, while Melbourne’s port handles the largest container volumes in Australia, further supporting demand for logistics space.
Infrastructure pipeline supporting growth
More than $200 billion in transport infrastructure investment between 2014 and 2036 is also expected to reshape the city and support future property values.
Major projects include the Metro Tunnel, the West Gate Tunnel, the North-East Link and the Suburban Rail Loop, which together will improve connectivity across Melbourne and its growth corridors.
Knight Frank’s Head of Research & Consulting, Victoria, Dr Tony McGough, said these investments would play a key role in supporting the city’s economic expansion.
“Melbourne is Australia’s most economically diverse city and has delivered stable growth for more than two decades,” he said.
“With strong population growth, a highly educated workforce and unprecedented infrastructure investment, Melbourne is well placed to remain one of Australia’s most attractive long-term property markets.”

Three-Michelin-starred chef Massimiliano Alajmo will host an intimate Mediterranean sailing aboard Crystal Serenity, redefining fine dining at sea.
Travellers are swapping traditional sightseeing for immersive experiences, with Africa emerging as a must-visit destination.