Buy now, pay later: The busiest year in Australian property was also the riskiest
Since the surge in buyer activity, average monthly mortgage payments have increased almost 50 percent, new data has shown
 2 min
2 min
Investment in property might be seen as a long term prospect but the latest figures from CoreLogic suggest not everyone is in it for the long haul. Property sales hit a peak in 2021, with an estimated 549,000 homes sold that year, new data has shown. That means that year, 5.3 percent of all property was bought.
The Australian property data service also revealed a whopping 20 percent of residences were purchased in the past five years. Brisbane had the highest rate of stock turnover in the past five years at 24.6 percent.

The CoreLogic report by head of research Eliza Owen noted that the upswing in buying in 2021 was at one of the riskiest times in the market in recent years, with super sized mortgages to match.
“One could argue then that the many Australians who purchased in 2021 were incentivised into the market at a higher-risk time,” Ms Owen said in the Pulse report. “Average loan sizes reported by the ABS escalated quickly (up almost 18pc over the year), and buying close to the market peak means there may be higher risk of low capital returns or value loss in the face of higher debt costs.”
However, the report said home values had increased by 7.6 percent since the end of 2021. Those who waited a year and purchased during the brief market dip in 2022 fared better, experiencing almost double the capital growth returns. Those who bought since then have been slugged with consecutive interest rate rises as the cash rate increased 13 times over 15 months from 0.1 percent in April 2022, stabilising at 4.35 percent since November 2023.

While Roy Morgan research in April revealed that 30.8 percent or 1,560,000 mortgage holders are at risk of mortgage stress, most are weathering the storm.
“It is likely most recent home buyers are coping with the stark change in mortgage rates and economic conditions,” Ms Owen said in the report.
“In the March Financial Stability Review, the RBA reported around 1 percent of home loans were in negative equity, and APRA reported just 1.6 percent of housing loans had mortgage repayments that were past due.
“Loan to valuation ratios for new mortgages generally trended lower through 2021, and over 90 percent of borrowers had at least a 10 percent deposit for new loans secured that year, providing a buffer against falling home values.”
Victorian auction buyers will soon receive a piece of information that has traditionally been withheld until bidding reaches it: the vendor’s reserve price. Under new property-sale and underquoting laws, agents must publish the agreed reserve at least seven days before an auction or fixed-date sale. Most changes begin on 1 October 2026 and apply to …
Continue reading “Victoria’s New Auction Rules Will Force Reserve Prices Into the Open”
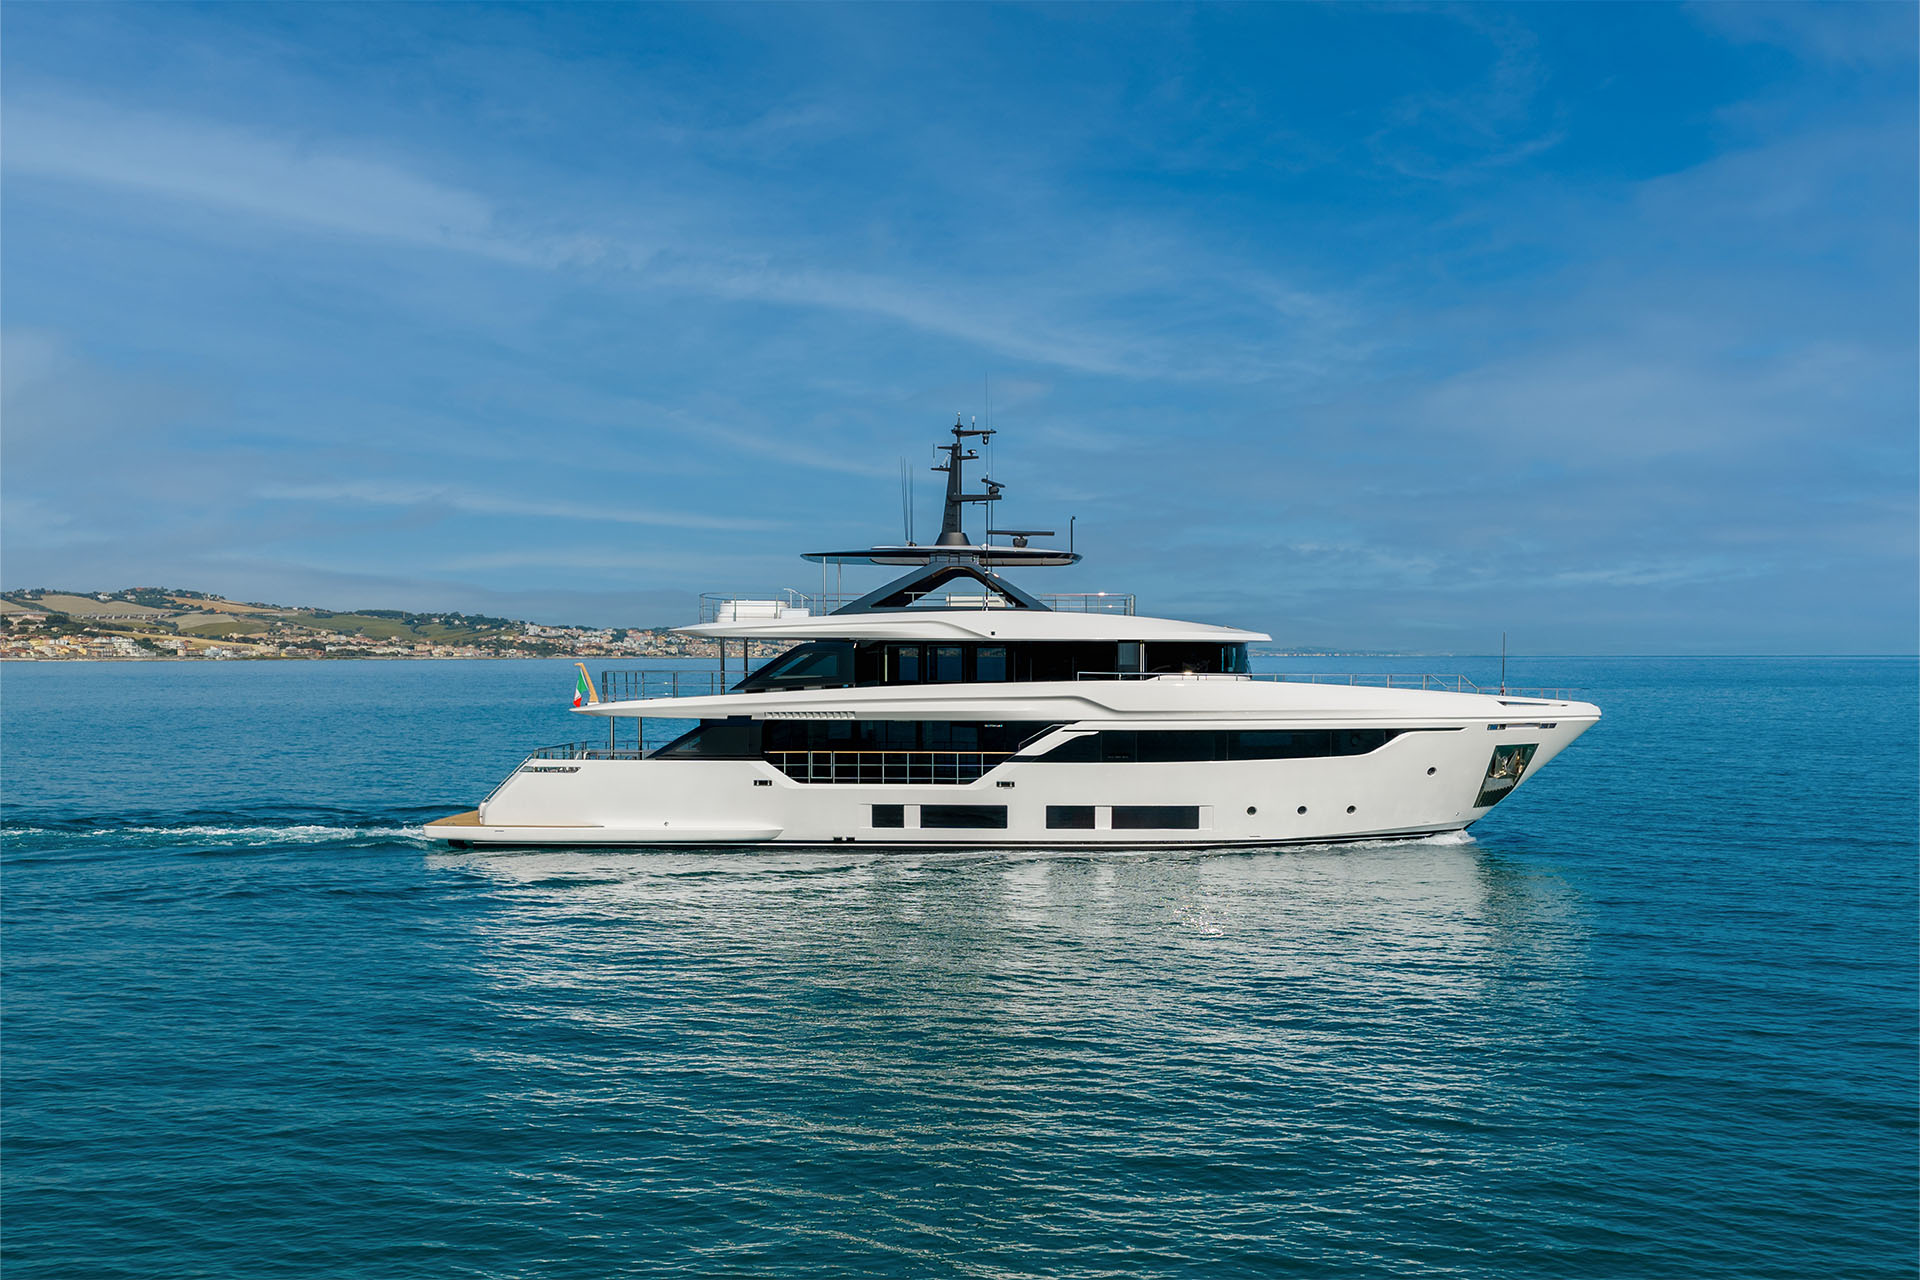
Four decks, 34.5 metres and a made-to-measure interior: step aboard the new Custom Line Navetta 35, unveiled at Cannes.
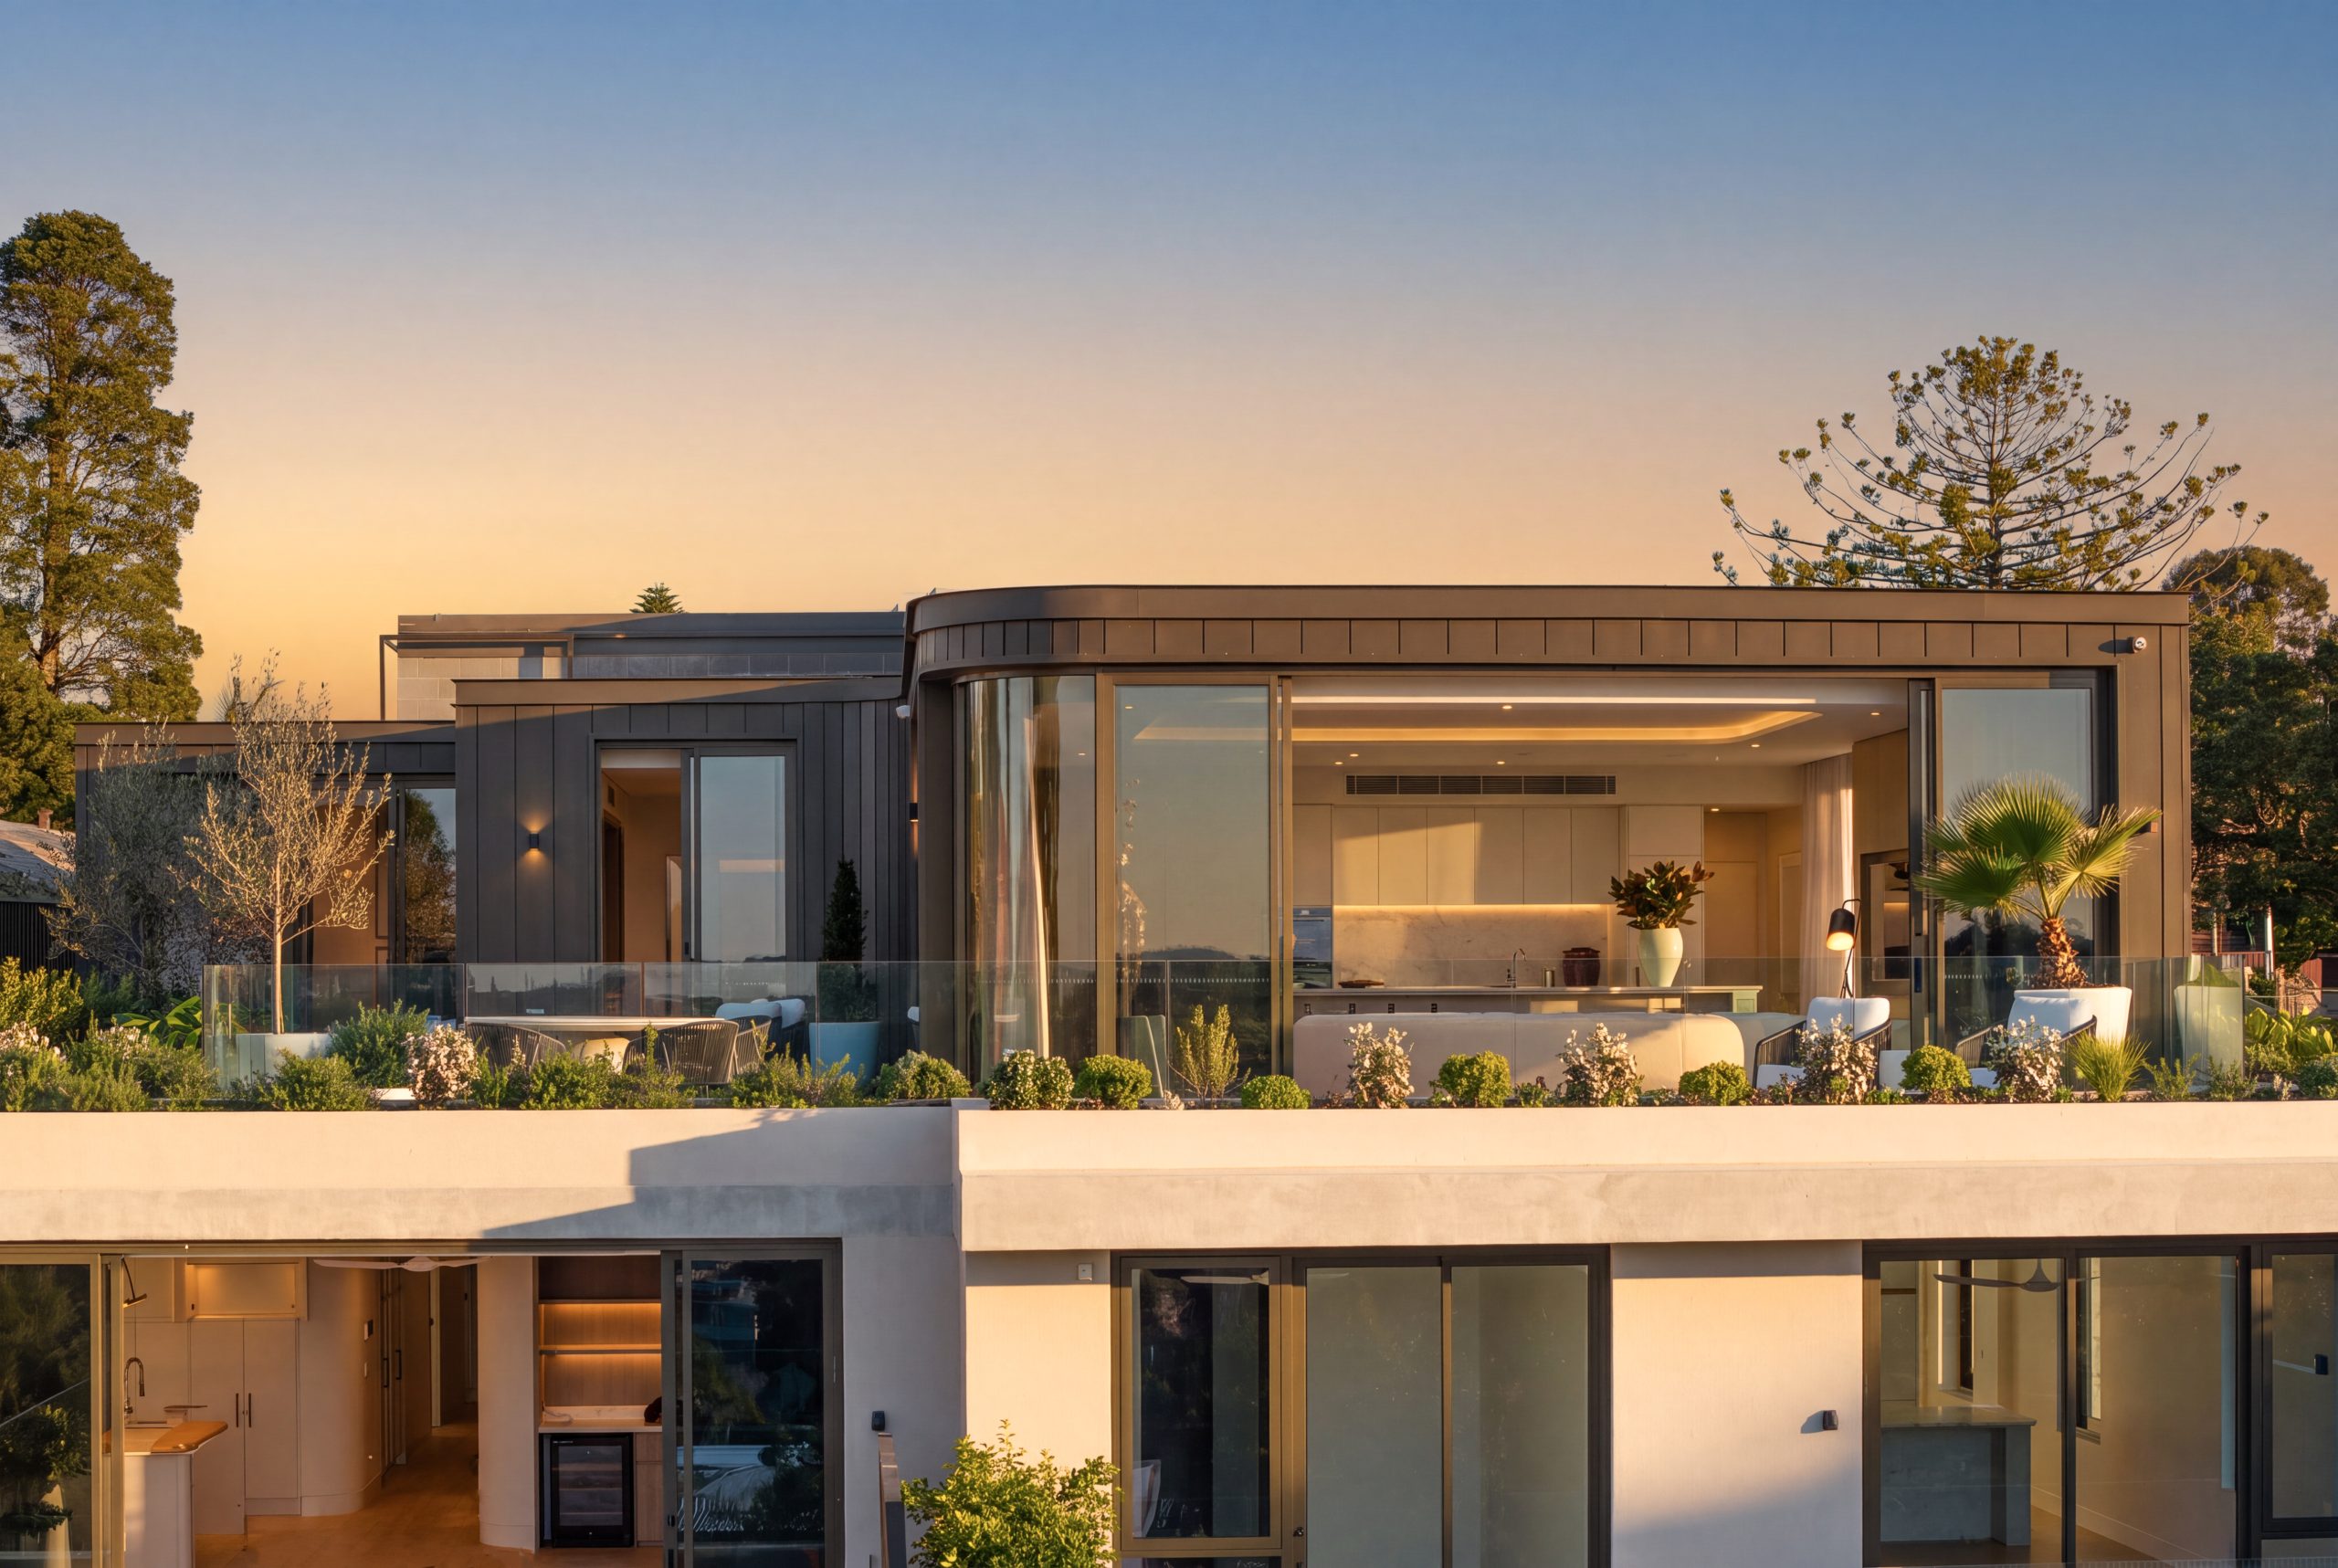
New detached-home sales fell 10% nationally in August, led by a 27% decline in Victoria, raising concerns about construction starts in 2027.
2 min
Australia’s hoped-for recovery in housing construction is losing momentum before it has had time to close the national supply gap.
Sales of new detached homes fell 10 per cent nationally in August, according to the Housing Industry Association’s survey of major volume builders across the five largest mainland states. It was the fourth consecutive monthly decline.
The fall was broad rather than isolated. Victoria recorded the largest retreat, down 27 per cent, followed by Queensland at 20.2 per cent, New South Wales at 17.5 per cent, South Australia at 10.8 per cent and Western Australia at 8.2 per cent.
Across the three months to August, sales were 19.3 per cent below the preceding three-month period and 7.7 per cent lower than the equivalent period a year earlier.
New-home sales matter beyond the immediate fortunes of volume builders. They are an early indicator of future starts: buyers sign contracts, finance is finalised, approvals are secured and construction follows months later. A sustained sales decline during the middle of 2026 is therefore likely to weaken commencements during 2027.
The slowdown reflects the collision of several pressures. Households have absorbed multiple interest-rate rises, reducing borrowing capacity and increasing the repayment cost attached to a new build. Established-home prices have softened in some markets, weakening the relative appeal of waiting through a construction period. Builders continue to face elevated labour and material costs.
The Reserve Bank’s August analysis showed new-dwelling construction prices increased 1.8 per cent during the June quarter and 5.3 per cent over the year. It attributed part of the pressure to oil-derived building products and other conflict-related costs.
Policy uncertainty can also cause buyers and investors to defer large commitments. But the precise contribution of any single tax or regulatory change is difficult to isolate from rates, confidence, land prices and construction costs. The HIA survey should be read as an indicator from large builders rather than a complete count of every dwelling sale.
The figures complicate progress towards the Housing Accord target of 1.2 million homes. The National Housing Supply and Affordability Council reported 308,000 completions since the Accord began and 244,000 dwellings under construction in the March quarter. Approvals and commencements had improved, but falling sales risk undermining the next wave.
For developers and governments, the warning is that planning approvals alone do not create homes. Projects need finance, viable construction pricing and buyers able to settle. If one part fails, approved supply can remain on paper.
Data box
National August new-home sales: Down 10 per cent
Three months to August: Down 19.3 per cent from the preceding three months
Year-on-year three-month comparison: Down 7.7 per cent
Victoria: Down 27 per cent
Queensland: Down 20.2 per cent
New South Wales: Down 17.5 per cent
South Australia: Down 10.8 per cent
Western Australia: Down 8.2 per cent

From Tokyo backstreets to quiet coastal towns and off-grid cabins, top executives reveal where they holiday and why stepping away makes the grind worthwhile.

A luxury lifestyle might cost more than it used to, but how does it compare with cities around the world?