Tornados! Fire! Ice Storms! These Real-Estate Agents Risk Life and Limb for the Sale

What is the worst weather you have ever had to contend with while showing a home?

Justin Fox, broker/owner, Re/Max Professionals, Cottage Grove, Minn.

In the summer of 2011, I was driving some buyers—a mother from out of town with her two young daughters, each under 6—to look at homes. The first two showings were uneventful, but as we headed to the third, we encountered a giant wall cloud on the road. I see wall clouds all the time, but for those not familiar with them, it’s a giant tower of clouds, and it’s very dark and ominous-looking, so it can be scary. My buyer, who claimed to have been some sort of weather watcher, started freaking out, saying things like, “That’s a wall cloud! It’s dangerous! We’re going to have a tornado!” That in turn caused the daughters to start screaming and crying hysterically. They were kicking so much in the back that they caused the threading of my leather seat to come loose. I did my best to calm them down, but then the torrential rain and thunder started, and that led to more screaming from the kids. Thank God we made it to the next house within 10 minutes. I pulled my car into the garage to avoid the hail, and we sheltered in the basement for 25 minutes until it lightened up outside. Then we went on with our showings like nothing ever happened.

Victoria Rong Kennedy, associate broker, the Corcoran Group, New York, N.Y.

I wouldn’t say this was the worst weather, but it was definitely the weirdest. On June 7, 2023, I had three private showings lined up at 2:30 p.m., 3 p.m. and 3:30 p.m. to show my listing on the Upper East Side, which was a duplex penthouse with three terraces listed for $3.3 million. That morning, Canadian wildfire smoke was blowing through the sky of Manhattan. They were telling everyone on TV and radio to stay home all day, and I kept watching my emails and texts, hoping that all three groups of buyers would cancel their showings, but no one did. By 1:30 p.m., the sky was really dark. There was almost no visibility, but, still, there were no cancellations. At 2 p.m., I searched for an old Covid mask, put it on and walked out like a hero to go on the combat field. I could barely see anything a half block away, but I walked 11 blocks and two avenues and managed to get to the building. Well, all three groups of buyers and their brokers showed up on time. We all chatted about how strange the weather was. We put our masks back on when we stood on the living room terrace, which overlooks Billionaires’ Row, but we had no visibility. The sky was red and black, and all we could see was a small circle of light in the sky. It looked like the moon behind heavy clouds. It was like a scene from a movie.

Jeffrey Decatur, broker associate, Re/Max Capital, Latham, N.Y.

Living in upstate New York, I have experienced all kinds of bad weather—snow so deep it was up to my thighs and rain so hard that I wished my shower had that much pressure. However, the worst took place in April 2017, when I was showing a home in Waterford, N.Y., a suburb of Albany. It was during a late-season blizzard that came on fast, and there had to be about 2 feet of snow. The home had a normal-size driveway, but it was a foreclosure and was not shoveled. So, my client and I trekked up the crunchy, snowy driveway and eventually got into the house. As we were walking around, complaining about the Arctic blast and blizzard, I heard the sound of babbling water. I thought it was a fountain, so my buyer and I continued to walk around the house. As we moved toward the garage and family room, the babbling got louder, and as we headed for the basement, we saw that the pipes had frozen. The basement ceiling had fallen, and water was pouring in from the ceiling and the walls. The floor had about 3 inches of water and ice. I called the listing agent and left a message, but I couldn’t just leave the water running, so I waded through the freezing cold water in the basement and turned the water off. I didn’t really think that through, because I was drenched and then had to make my way back through the house and out into the blizzard again. When I opened the front door, I nearly froze immediately, and by the time I got to the end of the porch, I was crunchy and icy. When I got to my car, parked at the end of the driveway, my hair was frozen to my face, and I could barely bend my legs or feel my hands. I was walking like the Tin Man. It took me several hours to thaw out.

——Edited from interviews

Why No One Wants to Pay for the Green Transition

In the past few years, Washington and Wall Street started fantasising that the transition to net-zero carbon emissions could be an economic bonanza. “When I think climate change, I think jobs,” President Biden said. When Wall Street heard green energy, it saw profits. As Ford Motor launched an electric Mustang and pickup truck, its market value topped $100 billion for the first time.

This year the fantasy ended. With electric vehicle demand falling short of expectations, manufacturers are dialling back production and buying back stock instead. Offshore wind developers have canceled projects. The S&P Global Clean Energy Index has fallen 30% this year. Ford’s market cap is down to $42 billion.

This doesn’t mean the transition to net zero is over. Officials meeting this week at the United Nations climate conference are just as worried about climate change. Renewable energy continues to expand. In the very long run, it is still the case that economic welfare will be higher with less global warming.

But the economics of getting to net zero remain, fundamentally, dismal: Someone has to pay for it, and shareholders and consumers decided this year it wouldn’t be them.

Politicians and the public tend to think all investment is good for growth, an error that leads to all sorts of muddled thinking about climate.

Technological transformations are positive supply shocks: a new, more efficient technology comes along, and investment naturally gravitates toward this new technology because it is profitable.

By contrast, the green transition is driven by public policy. It is “a negative supply shock, with an accompanying need to finance investments whose profitability cannot be taken for granted,” French economist Jean Pisani-Ferry wrote in a report commissioned by the French prime minister and released in English in November. “By putting a price—financial or implicit—on a free resource (the climate), the transition increases production costs, with no guarantee that the reduction in energy costs will eventually offset them, while the investments it calls for do not increase productive capacity but must nevertheless be financed.”

Pisani-Ferry, who is affiliated with the Bruegel think tank in Europe and the Peterson Institute for International Economics in Washington, is an uncommonly clear thinker on this issue.

He notes the transition involves hefty capital spending today to replace fossil-fuel consumption in the future. Pisani-Ferry estimates a middle-class French family would spend 44% of annual disposable income for a heat pump, and 120% for an electric car. These investments boost demand, but don’t leave families better off since they simply do the same thing as what they replace. And if taxes rise to pay for these investments, families will be worse off, financially.

“It would take an incredible act of blindness to fail to recognise that climate change is happening, that it is—and will increasingly become—severely damaging,” he writes. “It would also be incredibly flippant to claim that this urgent and imperative action will have no economic cost by 2030.”

The most efficient way to redirect consumption and investment from fossil fuels to zero-emissions energy is a carbon tax, or a cap-and-trade system. Europe has adopted such a system plus ever more stringent goals, especially after Russia cut off natural-gas supplies following its 2022 invasion of Ukraine. But as the cost has grown, so has public discontent, from France’s “yellow vest” protests in 2018 to last week’s first-place finish in Dutch elections by the far-right Freedom Party, which wants to ditch all climate regulations.

U.S. leaders have rejected any federal tax or fee on carbon. Biden’s solution is to not ask consumers to pay for the green transition; his Inflation Reduction Act pours, by some estimates, roughly $1 trillion into electric vehicles, renewable energy, hydrogen and other zero-emissions technology.

Subsidies can play a vital role by giving green energy time to scale up and innovate until it is competitive with fossil fuels. But the IRA has been undermined by extraneous conditions such as made-in-America requirements, and by green tech inflation—a byproduct of the IRA itself, which helped fuel demand.

Finally, Biden’s investment agenda was designed for the pre pandemic era when low interest rates flattered the financial profile of renewable energy investment and federal budget deficits were less likely to crowd out private investment. Those assumptions no longer apply.

For years, the cost of wind and solar plummeted, but since 2021 they have risen, according to investment bank Lazard. Interest rates are an important factor, which Lazard estimates affect offshore wind and solar more than natural gas.

Many developers can no longer economically supply power at the rates previously agreed to. Denmark’s Orsted, the world’s largest wind developer, took a $4 billion charge in early November for pulling out of two projects off New Jersey. The company today is worth 75% less than in early 2021.

ClearView Energy Partners estimates about 30% of state-contracted offshore wind capacity has been canceled, and another 25% may be rebid. ClearView analyst Timothy Fox noted lawmakers often mandate increased renewables, but utility regulators must approve the contracts, and one of their primary considerations is cost to ratepayers.

“I am an unapologetic economic regulator,” Diane Burman, a member of the New York state Public Service Commission, said in October as the commission refused to pay wind developers more. De carbonisation and grid improvement must proceed “with costs in mind.”

The financial appeal of EVs has similarly faded. Tesla proved making them can be profitable, but so far it looks like an outlier. Tesla captured the lion’s share of early adopters—drivers willing to put up with the cost and recharging hassle of an EV in return for performance and green credentials. For most drivers, the trade off still doesn’t work—even with subsidies.

True, the IRA has spurred a boom in EV and battery factories. But a successful green transition requires that those factories be profitable, and Detroit’s automakers are still losing money on every EV they sell.

EVs should eventually require less labor and thus be cheaper to build than gasoline-powered vehicles. But auto workers are no more willing to pay for the green transition than consumers or investors. In its recent strike, the United Auto Workers extracted commitments that make it even harder for Detroit to make money on EVs.

In a sobering report this week, Morgan Stanley auto analysts estimated the average non financial company in the S&P 500 spends its market cap in capital expenditure and research and development in about 50 years. GM and Ford spend theirs in 1.9 and 2.6 years, respectively. “This cannot continue, in our view.”

The green transition remains critical, but its path will be fraught until someone agrees to pay for it.

10 Swimming Pool Designs To Beat The Heat

There’s nothing more appealing than being able to cool off in your own pool on a hot summer’s day. For many Australians, the idea of a backyard pool is enticing but with so many styles to choose from, the decision is not always straightforward. Considering your budget, the needs of your household, along with the size of your outdoor space is key to achieving the best outcome for delicious days poolside. We take a deep dive into the best in pools to get you into the swim.


CLASSIC RECTANGLE

Narellan Pools Symphony Pool

Nothing beats this classic pool design. With the ability to cross styles of architecture from Hamptons to mid century modern and minimalist design, the rectangular pool is a ‘one size fits all’ style that adapts to most needs, from swimming laps to splashing about with the kids. Go as big as you can manage on acreage or shoehorn it onto a suburban block for a clean, classic look that’s hard to top.


INFINITY POOL

Infinity Edge Swimming Pool | Blue Haven Pools
Blue Haven Pools

A popular choice where there are views of the water or bushland to enjoy, an infinity pool gives the illusion of having no edge. Also known as rimless, overflow or zero edge pools, the water flows over the edge of the pool into a catchment basin that sits below the waterline, out of sight. A great choice for elevated positions where the pool can create a visual bridge between the house and the view, an infinity pool is particularly expensive to install and run thanks to the continuous need to pump water from the catch basin.


LAGOON OR FREE FORM

free form pool
Baden Pools

Designed to mimic the natural environment, lagoon or freeform pools have fallen out of favour since their heyday in the 1980s. Despite the name, they are often available in standard sizes in fibreglass or concrete and are characterised by their curved, asymmetrical shapes. Slides and waterfalls are popular accessories to this style of pool while landscaping is typically tropical, in keeping with the oasis-like environment.


LAP POOLS

Lap Swimming Pools Builder in NSW | Blue Have Pools
Blue Haven

While the name might suggest that this style of pool is aimed at hard core swimmers, lap pools are a great choice where the obvious location for the pool is long and narrow. If doing laps or water therapy is the main purpose for installing the pool, consider installing swim jets which create non-stop resistance to swim against. A lap pool should be at least eight to 10 metres long to be useful.


PLUNGE POOLS

4 Creative Plunge Pool Designs
Pool & Spa

Nothing beats being able to cool off in your own backyard over summer and what plunge pools lack in space, they can make up for in amenity. While swimming is probably out of the question, plunge pools are generally easier and cheaper to maintain than their larger counterparts, making them an attractive option for heating and cooling. They also have the obvious advantage of being able to fit into most backyards.


SPOOLS (SPA POOLS)

What is a Spool? - Precision Pool and Spa
Precision Pool and Spa

Another great option where space is an issue, spa pools, also known as spools, offer the best of both worlds, with a spa area integrated into all or part of the pool. Known in some places as a cocktail pool, they can be a great solution for those who like to entertain or simply passively enjoy the water. Costs are generally a little less than a conventional pool and more than a dedicated spa.


PERIMETER OVERFLOW POOLS

Perimeter Overflow Pools - Georgia Pools | Peachtree City & Atlanta Area Pool Builders
Georgia Pools

For those who love the integrated look, perimeter overflow pools are a stylish choice. Designed in line with the edge of the deck, the water gives the impression of overflowing at all edges for a sleek, minimalist look. Water is captured and recycled in channels around the perimeter. Available in a variety of shapes and sizes, this style of pool can be pricey to install and run. For level sites though, it’s the ultimate in swimming luxury.


NATURAL POOLS

Natural swimming pool business is booming | The Fifth Estate
Natural Swimming Pools – Hampton Rock Pool

While conventional pools are kept clean through the use of chemicals such as chlorine, natural pools rely on moving water (via a pump) and biological filters such as plants to maintain good water quality. It’s a style gaining ground in Australia, where water quality is naturally quite high, making the move to natural pools easier, and more homeowners become interested in chemical-free options.


ABOVE GROUND POOLS

Green above ground pool in lush setting
Jeerayut Rianwed / Getty Images

The great advantage of this style of pool is that excavation is often minimal, which means less disruption – and less cost. Strictly speaking, there’s any number of materials available for construction, including fibreglass and concrete, but the above ground pool is probably most often associated with the old-school modular pool with liner from the likes of Clark Rubber.


GLASS WALLED POOLS

003
Senator Pools

If you’re looking to add a little drama to your home, a glass walled pool could fit the bill. Essentially an underwater ‘window’ in recent years, architects have specified glass walled pools to be viewed from inside the house, with the benefit of drawing natural light through the water into internal spaces. An engineer will specify the exact thickness required to take the weight of the water but expect it to be at least 12mm thick.

What is the best type of swimming pool to build?

The type of pool you choose will depend on your budget and the size and style of your yard. Fibreglass pools come in a range of shapes and sizes and are faster and easier to install than concrete, mainly because they are made on the factory floor and delivered to site. Concrete pools take longer to build but they are customisable and can be finished in high end materials. Often, the decision can get down to how long you intend to stay in your property in terms of how much you want to invest.

What is the most expensive part of a pool?

If you’re talking about construction, excavation is often the big cost that takes owners by surprise. Make sure you understand excavation and tipping costs before signing a contract. Filtration, decking, tiling, fencing and landscaping can all add significant cost to the construction and installation of a pool. In terms of running costs, solar energy can be a good way to offset expenses.

What is a good size for a home swimming pool?

Again, this will depend on the size of your outdoor space, your lifestyle and the people who will use your pool. A family of four will have different needs to a couple who prefer to enjoy a dip at the end of a hot day. Choose a size that allows everyone to move around freely while keeping in mind that the larger the pool, the greater the time and money required to maintain it. Pool sizes in Australia have shrunk in recent years but popular sizes for family pools range from 7m by 3m up to 9m by 4m. Speak to your pool builder about the best – and safest – depth for your needs.

Australians on the move as housing affordability worsens

Frustrated aspiring home buyers and renters fed up with high runaway prices in certain markets may resort to moving interstate in 2024, according to analysts. In the latest Housing Affordability Report released by ANZ and CoreLogic, analysts say housing affordability has worsened due to rising migration and interest rates on top of longer-term factors such as governments not building enough social and affordable housing to keep up with demand.

There is no quick and easy supply response to rising rents and home values,” according to the report. As a result, 2024 may see more internal migration of prospective first home buyers and renters to markets with relatively low price points.” ANZ and CoreLogic point to data tracking historical net internal migration trends against the current median value of dwellings. Internal migration was higher across areas with relatively low median values at that time,” the data shows.

During the pandemic, internal migration patterns changed as more people left Sydney and Melbourne, in particular, and relocated to the regions. Being able to work from home enabled many families to move to lower-cost markets and attain a better lifestyle. Queensland – especially the Gold Coast and Sunshine Coast, along with regional NSW and Victoria — were key beneficiaries of this trend. In 2022, NSW lost 31,560 residents and Victoria lost 9,955 due to net internal migration, while Queensland gained 34,545 residents, according to the Australian Bureau of Statistics (ABS).

The ANZ/CoreLogic report also predicts that more Australians will choose to share a property to save money in today’s cost-of-living crisis. Multi-generational living among families is a rising trend among home owners, and in the rental market, there is surging demand for share houses to make the rent more affordable for individuals. This represents a reversal of pandemic trends, say the analysts.

In addition to changing location preferences, there could also be some preference shifts around the number of people sharing a household in 2024. The pandemic period saw a notable drop in average household size from 2.55 people per household to 2.49 as of 2023. This may have reflected greater demand for space as more time was spent at home, a temporary rise in available rentals at the very start of the pandemic, and high levels of fiscal stimulus supporting incomes. However, this trend could reverse as more people take up share housing to alleviate housing costs.

The interest rate hiking cycle is likely coming to an end, which will ease pressure on mortgage serviceability, but the analysts note that a steady or falling cash rate typically results in upward pressure on prices. Additionally, the current drop-off in new dwelling approvals may hinder housing supply growth for some time. Ultimately, improved housing affordability in the long term is likely to depend on deliberate initiatives to increase housing supply, rather than relying on a temporary downswing in prices or cyclical reduction in interest rates.

The report also finds that regional markets are not as affordable as they used to be following the pandemic boom. As of October, regional home values are 44 percent higher than at the start of COVID compared to capital city prices being 26 percent higher.

The report also notes a widening price gap between Sydney and Melbourne, with Melbourne the only capital city where affordability for buyers has improved over the past five years.

More modest dwelling value increases in Melbourne, which has led to Melbourne being more affordable relative to Sydney over time, comes down to more supply of dwellings over the past 15 years,” the report states. “ABS building activity data shows there were around 850,000 dwelling completions across Victoria in the 15 years to June 2023, which is 21% higher than in NSW over the same period.”

What Will Motivate More People to Make Their Homes More Energy Efficient?

How do you get people to reduce their home’s carbon footprint?

The U.S. government hopes the answer is to appeal to their pocketbooks. As part of the Inflation Reduction Act, the government is rolling out increased federal tax credits and rebates to help offset the cost of energy-efficient upgrades such as electric heat pumps and added insulation, and adoption of clean-energy technologies such as rooftop solar.

But recent research suggests that some financial incentives might be more effective than others when it comes to getting middle- and lower-income consumers to make energy upgrades. Researchers also have found that social pressure can be effective: Consumers notice what their neighbors do, and energy providers might be able to leverage that to get people to make changes, researchers say.

Here is a closer look at what researchers have found that does and doesn’t work:

Money makes a difference—sometimes

One concern about many clean-energy tax credits is that historically they have disproportionately benefited the rich. Researchers say wealthier people are more likely to live in single-family homes, where it is easier to install things like rooftop solar and charge electric cars. It also could be that lower-income families have much lower taxes and thus benefit less from these kinds of tax breaks. So for many households, tax credits don’t talk.

But recent research from Lucas Davis, a professor at the University of California, Berkeley’s Haas School of Business, suggests that one of the enhanced energy tax credits in the Inflation Reduction Act could prove to be an exception to this rule.

In a study published this year, Davis and his co-authors found that 14% of U.S. households have a heat pump as their primary heating equipment, and that adoption levels are remarkably similar across different income levels, and even between homeowners and renters. Heat pumps often cost less than installing separate heating and cooling systems. And states with low electricity prices tend to have more heat-pump users since they cost less to operate in those areas.

Those findings suggest that the federal tax credit for purchasing and installing a heat pump—which increased to $2,000 from $300—has the potential to be more widely distributed across income levels than subsidies for many other low-carbon technologies, says Davis, and consequently get more people to invest in the equipment.

Another recent study looked at residential solar-adoption trajectories and why some communities lag behind others. The authors used satellite imagery and computer vision to capture the year-over-year growth of residential solar panels in 46 states between 2006 and 2017. They then looked at what the federal, state and municipal incentives were in place when the panels were installed.

They found that performance-based incentives—payments made to solar-panel owners based on how much electricity their system generates over a certain period—were associated with higher solar adoption rates in lower-income and middle-income communities than incentives tied to property taxes or rebates paid via lower state or municipal taxes.

In some cases, consumers can benefit from both performance-based incentives and net-metering programs, where homeowners can sell back to the utility any surplus power their solar system produces on sunny days, and use those credits to offset the cost of the power they pull from the grid at night or on cloudy days, resulting in a lower electric bill.

“Performance-based incentives reduce the upfront costs of solar panels for homeowners,” says Ram Rajagopal, an associate professor at Stanford University and one of the paper’s co-authors, explaining that if solar installers collect the performance-based incentives, homeowners can lease the panels at a discounted rate and still get the benefit of saving on their monthly electric bill.

A third recent study, meanwhile, finds that net metering and high electricity are two big factors that correlate with rooftop-solar adoption across the U.S. The authors conclude that anticipated electricity-cost savings could stimulate further solar deployment, especially in areas where people are skeptical about global warming, and should be incorporated into promotional campaigns.

Taken together, the recent studies suggest that when it comes to solar adoption, incentives that provide an immediate financial benefit—say, lower upfront installation costs and savings on electricity bills—could be more motivating to low- and middle-income households than tax credits they have to wait to collect.

Keeping up with the Joneses

Researchers also are examining whether social networks and connections can be leveraged to convince more households to make energy upgrades.

“Social norms and interactions affect people’s behaviour, and alternative energy is no exception,” says Kenneth Gillingham, a professor of economics and senior associate dean at Yale School of the Environment, whose work suggests solar-panel adoptions tend to happen in regional or geographic clusters.

Among Gillingham’s findings are that households are more likely to install solar panels if they can see their neighbours’ solar panels from the road. A forthcoming study of his finds that solar-panel installers are likely to reduce prices for customers whose homes are in centralised locations, since their installation is likely to encourage others to follow suit.

Researchers also are studying if the neighbour effect can be used to recruit households in lower-income communities for state and municipal programs that offer free home-energy audits or subsidised solar-panel installations.

The administrators of such programs often struggle to identify which households are eligible. And potential customers often lack key information, are turned off by the paperwork or don’t trust program providers, says Kim Wolske, a research associate professor at the University of Chicago’s Harris School of Public Policy.

“Even when the energy upgrades are free, past research suggests it can be difficult to recruit lower-income households,” she says.

In a recent study, Wolske and her co-authors asked 7,680 low-income homeowners who recently received free installation of solar panels if they could refer other potential customers.

To identify the best approach, the authors divided homeowners into three groups. The control group received a postcard saying they could get $200 for every referral that signed up for solar panels. The second group received that same offer plus a $1 thank-you gift, designed to remind them of the value of the installed solar panels (about $20,000) and to encourage them to return the kindness by referring another homeowner. The third group received the $200 offer, the $1 gift and a form where three referrals could be made along with a stamped and addressed envelope.

The researchers found that homeowners in the third group, who received the stamped and addressed envelope, were 7.5 times as likely to make referrals than the control group, and those referrals were 5.2 times as likely to result in a new solar contract.

How do you compare?

Energy providers, meanwhile, are testing whether they can nudge homeowners to make energy-efficiency improvements by comparing their energy use with that of neighbours.

Not only do such home-energy reports coax people into changing their behavior—say, turning off unused lights or turning down the heat—they also encourage people to make energy-efficient updates in their home, like buying Energy Star appliances, research shows.

A study published in 2022 found that energy consumption in homes that received a home-energy report remained low even after utilities stopped sending the reports and the owners sold the home, suggesting that the long-lasting benefits of these programs come from energy-efficient upgrades.

Another study in Southern California looked at the effect of sending home-energy reports and an additional nudge, called a peak energy report. Peak energy reports are automated phone calls or emails, reminding energy customers to reduce energy consumption during peak hours when demand for electricity exceeds supply.

The researchers found that when customers received both the home energy report and the peak-energy nudge, they reduced their electricity consumption on average by about 6.8%. Customers who received just one of the nudges also reduced their consumption but less so.

“Comparing customers provides a reference for energy usage and taps into their social consciousness,” says Robert Metcalfe, an associate professor of economics at the University of Southern California and author of the two studies on nudges.

Keep the Ambition, Lower Your Ego. How to Thrive as a No. 2 Like Charlie Munger.

Charlie Munger was Robin to Warren Buffett’s Batman, a business equivalent of the Edge rocking with the Bono of investing.

Munger, who died Tuesday at age 99, played one of the toughest roles in the corporate (or any) world: No. 2.

Succeeding as second in command takes a rare blend of confidence and humility, say people who’ve done it. The consummate right-hand person must be devoted to organizational success while accepting that someone else’s star will always shine brighter.

At a time when many American workers are reconsidering whether the race to the top is worth running at all, Munger’s apparent satisfaction with being the ultimate sidekick could be a model.

It helped that Warren and Charlie, as the duo was known, shared a personal friendship. And being a wingman is presumably more fun when you’re a billionaire, as Munger was. Most important, say those who knew him: Munger knew he was respected and appreciated.

Buffett made sure of it.

Harry Kraemer, former chief executive of the healthcare company Baxter International, recalls a conversation with Buffett at a CEO gathering around the year 2000: “I said, ‘Boy, you’ve got an amazing track record.’ And he goes, ‘It isn’t just me. Never mention my name without Charlie’s.’”

In a recent annual letter, Buffett wrote: “I never have a phone call with Charlie without learning something.”

There aren’t many pairs like Buffett and Munger. An analog might be the late Canadian telecom mogul Ted Rogers and his longtime lieutenant, Phil Lind, who died in August at age 80. Robert Brehl, who co-wrote Lind’s 2018 memoir, “Right Hand Man,” says loyalty is essential to a relationship like Rogers-Lind or Buffett-Munger.

Having complementary strengths and interests helps ward off resentment, Brehl adds.

“You have to have the yin and yang,” he says. “Ted wouldn’t have been as effective without Phil, and the same thing with Warren and Charlie.”

Before meeting Buffett, Munger was already a professional success. He served in World War II, went to Harvard Law School and co-founded a law firm, Munger, Tolles & Olson, where his name was first on the door.

Even though his results as an investor were strong, over time, he realised he could be more successful—and happier—in a partnership. Understanding his own shortcomings contributed to his willingness to become Buffett’s running mate, he has said. He rejected Buffett’s initial overtures before agreeing to come aboard.

“It took me a long time to wise up that [Buffett] had a better way of making a living than I did,” Munger told CNBC in 2021. “But he finally convinced me that I was wasting my time.”

Not that it was easy to set aside his ego to take the No. 2 role and play to what his No. 1 needed. Buffett was Berkshire Hathaway’s public face and larger-than-life persona. Munger seemed to relish his freedom from talking to reporters and investors. In the background, he could be sharper, more direct and funnier.

The durability of the Buffett-and-Munger duo act stemmed, in part, from a shared intellectual curiosity, a measure of humility—for billionaires, anyway—and willingness to learn from their mistakes.

“I constantly see people rise in life who are not the smartest, sometimes not even the most diligent, but they are learning machines,” Munger said in his commencement address to the University of Southern California’s law school in 2007. “They go to bed every night a little wiser than they were when they got up and, boy, does that help, particularly when you have a long run ahead of you.”

Savvy runners also know it can be best to let someone else take the lead to break the wind. A certain type of person prefers to run second, says social psychologist Tessa West, who is studying people she calls “runners up” for a forthcoming book.

“Once you get to a certain level of power, you realise that that top position doesn’t necessarily come with more influence—it just comes with more publicity and a lot more reputational risk,” she says. “The way I see it, Munger got to have his cake and eat it too. He had status without all the headaches.”

He also had a life outside of Berkshire and Buffett. One of Munger’s pet projects was a quest to design the perfect college dormitory.

He’ll be remembered as the consummate consigliere, but that wasn’t his whole identity.

—Geoffrey Rogow contributed to this article.

Higher deposits, stretched LVRs & more borrowers needing mortgage insurance

The amount of money required for a home deposit is rising and more than half of home buyers had to pay lenders’ mortgage insurance in FY23, according to a new report released by PEXA.

NSW recorded the highest median deposit in FY23 at just below $120,000, up 3.9 percent on FY22. In Victoria, the median deposit was $84,723, down 0.5 percent, and in Queensland it was $78,143, up 8.5 percent.

The time it takes to save these deposits is on the rise. Based on the median family income in each state and a 15 percent savings rate, PEXA found NSW buyers now need an average of almost eight years to save their deposit. This is up a whopping 83 percent since 2020. It takes Victorian buyers a little over five years to save their deposit, up 64 percent since 2020. It takes Queensland buyers just under five years, up 37 percent over two years.

Average deposit-to-value ratios (DVRs) increased to about 20 percent across the three major eastern states as a result of lenders tightening their credit criteria in FY23. The DVR is the amount of cash a buyer contributes to a purchase. The average DVRs in FY23 were 20.4percent in NSW, up 1 percent on FY22; 19.5 percent in Victoria, up 0.8 percent and 19.8percent in Queensland, up 1.5 percent.

The PEXA data shows most borrowers are taking out the maximum possible LVR (loan to value ratio) to fund their purchases. The average LVRs among borrowers in FY23 were 79.6 percent in NSW, 80.5 percent in Victoria and 80.2 percent in Queensland. The research shows the major banks averaged higher LVRs, suggesting they are more open to lower deposit borrowers, due to their visibility of borrower’s income and expenditure via existing banking relationshipsThis also meant more major bank customers had to pay lenders’ mortgage insurance (LMI).

Most lenders will not lend more than 80 percent of a property’s value without forcing the borrower to pay LMI. This insurance protects the bank from default and can be very expensive. Over half of new borrowers had to pay LMI in FY23. The rate was highest in Victoria, where 56.5 percent of new borrowers had to take out LMI.

The PEXA report said rising property prices meant buyers needed higher deposits, making it tougher to buy a home and making the “generational wealth gap more apparent”.

As a result, younger buyers are increasingly tapping the Bank of Mum and Dad to help them achieve the required deposit, as well as taking advantage of government support through various programs.

Princess Diana’s Blouse, an Animatronic E.T. Head, and ‘Big Lebowski’ Robe Headline Memorabilia Auction

The blouse Princess Diana wore for her engagement portrait, E.T.’s head, and the robe “The Dude” wore in The Big Lebowski are just some of the wide range of instantly recognisable pop culture artefacts going up for auction next month.

Julien’s Auctions is partnering with Turner Classic Movies for the Dec 14-17 sale, titled Hollywood Legends.

“Associated with phrases such as ‘Danger, Will Robinson,’ ‘E.T. phone home,’ and ‘Avengers, assemble!,’ these iconic collectibles provide a once-in-a-lifetime opportunity for fans, pop culture enthusiasts, and collectors to own a piece of Hollywood history,” Martin Nolan, Julien’s co-founder and executive director, said in a statement announcing the sale Monday.

The sale comprises three components taking place over four days at The Beverly Hilton in Beverly Hills (Dec. 14), Julien’s facility in Gardena, Calif. (Dec. 15-17), and online at JuliensLive.com.

Featuring props, costumes, and models from some of the most iconic science fiction, fantasy, action, and superhero franchises dating back to the 1950s, the first program—billed as Robots, Wizards, Heroes & Aliens—will be held during the sale’s first two days (Dec. 14-15). In celebration of Warner Bros.’ 100th anniversary, an assortment of items from the studio’s biggest film franchises, such as Harry Potter and Batman, will be offered.

Princess Diana’s Engagement Blouse
Julien’s Auctions

The marquee item is an original mechanical animatronic E.T. head—created by the legendary special effects artist Carlo Rambaldi and as seen throughout Steven Spielberg’s 1982 film E.T. the Extra Terrestrial—that’s estimated to fetch between US$800,000 and US$1 millionThis model comes from Rambaldi’s own collection, as did the animatronic figure of E.T. sold by Julien’s Auctions last November for US$2.56 million.

Also sure to draw heightened interest is one of the most famous robots of all time, the Model B-9 from Lost In Space. One of only two full-scale figures that were made for the pioneering 1960s science fiction series, the still-functional model is expected to sell for between US$300,000 and US$500,000.

Fans of the Coen Brothers’ 1998 classic film The Big Lebowski will focus on day three (Dec. 16) of the sale, which will celebrate the film’s 25th anniversary. More than 250 items, including storyboards and costumes, will go under the hammer, with a portion of the proceeds going to Share Our Strength’s No Kid Hungry campaign.

Expected to draw the highest bids are a pair of lots featuring items worn by Jeff Bridges in the title role. Estimated to go for between US$30,000 and US$50,000, The Dude ensemble—which appears throughout the film, including in the memorable opening scene—consists of a light-brown knitted fleece bathrobe and an off-white cotton Jockey T-shirt. An original pair of sunglasses featuring nylon frames with amber-colored polycarbonate lenses is expected to sell in the neighbourhood of US$20,000 to US$30,000.

Glamour, Grace and Greatness, the third component of the auction, will close out the sale’s final day (Dec. 17) with items created by revered designers and worn by some of the greatest style icons of all time.

Headliner status goes to a piece from one of the most iconic images ever taken of Princess Diana: the blush pink chiffon blouse worn in her 1981 engagement portrait—famously captured by the world-renowned photographer Lord Snowden for the February 1981 issue of Vogue—is estimated to fetch between US$80,000 and $100,000. With its ruff-like collar and loose pleats to the front, the garment was created by designers David and Elizabeth Emanuel, who would later design Princess Diana’s wedding gown. The blouse, which Elizabeth Emanuel sold from her archives in 2010, was admired by millions when it was previously on display at London’s Kensington Palace as part of the exhibition “Diana: Her Fashion Story” that ran from 2017 to 2019.

E.T’s Animatronic head
Julien’s Auctions

Another famous piece sure to draw intense bidding is a ballerina-length evening dress from the Moroccan-British fashion designer Jacques Azagury that was worn by Princess Diana in Florence, Italy on April 23, 1985. Featuring a black velvet bodice with embroidered stars in metallic thread, and a two-tier royal blue organza skirt with sash and bow, the dress is estimated to sell for between US$100,000 and US$200,000.

Other highlights include Givenchy-designed garments worn by Audrey Hepburn in one of her most memorable roles as Regina “Reggie” Lampert in the 1963 film Charade. A marigold wool coat is expected to sell for between US$20,000 and US$40,000, while a cream wool dress is estimated to earn between US$30,000 and US$50,000.

Fans of timeless classics can bid on iconic pieces such as the dramatic black satin sleeveless gown worn by Gloria Swanson as Norma Desmond in the 1950 film Sunset Boulevard and the blue and white cotton gingham pinafore worn by Margaret O’Brien as Tootie Smith in the 1944 musical comedy Meet Me in St. Louis.

Art Is a Rising Focus for Wealth Managers and Family Offices

The value of art and collectibles owned by the world’s wealthiest individuals totaled nearly US$2.2 trillion as of last year, an amount that could grow to nearly US$2.9 trillion by 2026, according to recent analysis from wealth management advisor Deloitte Private and ArtTactic, a research and analysis firm.  Yet, the art market overall has grown only 0.6% annually since 2008, failing to keep up with inflation, and with the surge of growth in overall global wealth.

Deloitte Private—a division of U.K.-based Deloitte—and London-based ArtTactic said in the eighth edition of their biennial Art & Finance Report. That means there are many more wealthy people who could own art.  The report proposes an intriguing reason for the stunted growth: The fact that more than three-quarters of auction sales are generated by the work of a little more than 1% of all artists.

“We can assume that only a small percent of art buyers are behind these transactions, which leaves us with a heavy concentration around a small number of artists and buyers—plus a small number of art professionals (galleries, auction houses, etc.),” the report said. “Could this be one of the main reasons for the art market’s overall lacklustre growth in the last decade?”

The more than 400-page report, which examines trends and developments at the intersection of art and wealth management, is informed by surveys with private wealth managers and this year, with several family offices, where art and collectibles comprise 13.4% of client assets—five percentage points more than at private banks.

“While art and collectibles provide portfolio diversification and potential value appreciation, they often are a more personal investment with emotional ties to the family’s interests and preferences,” Wolf Tone, the global leader of Deloitte Private, said in the report.

Overall, 89% of wealth managers in addition to collectors and art professionals who were also surveyed, believe “art and collectible wealth should be part of a wealth management offering,” up from 65% that said so in the first Art & Finance survey in 2011.  One reason art is touted as an investment option is its value doesn’t move in sync with traditional market instruments; another reason is the perception that the art market’s performance has been relatively strong compared with measures such as the S&P 500—a broad measure of U.S. stocks.

Fine art indexes developed by New York-based Artnet Worldwide Corp. reveal a more nuanced picture. In the five years up to the first half of 2023, the compound annual growth rate for fine art was a negative 0.4% compared with a 10.4% gain for the S&P 500, according to Artnet. Looking at individual investing categories, European Old Masters recorded a 1.6% CAGR in that period, while global post-war art (by those born between 1911 and 1944) posted a CAGR of 1.4%.  Over 10 years, the CAGR for fine art overall was only 0.1% compared with a 10.7% gain for the S&P 500, according to Artnet. Artnet analysts noted in the report, however, that art—as a physical asset—is a better hedge against inflation than traditional market instruments, such as stocks, which are valued according to the expected future cash flows of their underlying businesses. Fine art returns rose 4.2% between January 2022 and July 2023 compared with a 6.6% decline in the S&P 500.

“Despite a spike in inflation and higher interest rates, art prices suffered less than other asset classes during this period of economic stress, demonstrating the asset class’ ability to serve partially as an effective hedge, especially regarding the blue-chip, high-end fine art category,” the report said.  Though the report confirmed that most people still buy art because they like it—60% of collectors are driven by art’s “emotional value,” consistent with past years—financial factors are rising in importance. For the first time, 41% of collectors surveyed said their primary motivation for buying art was financial, overtaking “social value” as the second-ranked motivation.

One reason is that younger collectors are largely driven by financial considerations: 83% cite potential investment returns as a key reason to buy art, up from 50% in the last survey in 2021. Of those surveyed, 61% also cited portfolio diversification as a driver and 51% said art can be a safe haven in uncertain times, up from 34% in 2021.

“This tells us about how the new generation of collectors may relate to art as an alternative capital asset class, both now and in the future,” the report said.  The rise of art investment vehicles, particularly fractional-art platforms that allow individuals to buy a share in a painting as they would a share of stock, are another factor: 50% of younger collectors are interested in fractional ownership, up from 43% in 2021, the report said. The most popular way to buy art remains just that—directly buying a piece, according to 88% of collectors and 83% of art professionals.

Yet fractional ownership is making inroads, particularly as more initiatives offer options that are supervised by regulators in the U.S., Europe, and Asia. Though resistance remains, the report said the emergence of these platforms “could allow art and collectible assets to be more easily integrated into asset management allocation strategies in the future.”

Inflation takes a dip, while bananas and melons make a mash of prices

The rate of inflation in Australia has fallen to 4.9 percent, according to data from the Consumer Price Index. Inflation is down from 5.6 percent in September and a peak of 8.4 percent in December 2022.

The housing, transport and food and non-alcoholic beverages sectors were the strongest contributors to the October increase, which is consistent with trends shown in ABS data from September.

“CPI inflation is often impacted by items with volatile price changes like Automotive fuel, Fruit and vegetables, and Holiday travel,” said acting head of price statistics at the ABS, Leigh Merrington. “It can be helpful to exclude these items from the headline CPI to provide a view of underlying inflation.” 

Food and non-alcoholic beverages rose from 4.7 percent in September to 5.3 percent in the 12 months to October, driven by the rising prices of melons and bananas. 

Banana prices are trending upwards, contributing to higher food prices overall. Credit: Nigel Killeen/Getty Images

In good news for would-be home builders, new dwelling prices rose 4.7 percent, the lowest annual rise since August 2021, as a result of easing material supply conditions.

While the ABS noted that electricity prices rose 10.1 percent in the year to October, Mr Merrington said it could have been worse, if not for the introduction of the Energy Bill Relief Fund.

“Electricity prices have risen 8.4 per cent since June 2023. Excluding the rebates, Electricity prices would have increased 18.8 per cent over this period,” Mr Merrington said.  

The inflation figures come ahead of the final meeting for the year of the RBA Board next Tuesday. The board raised the cash rate by 25 basis points at the November meeting following an increase in the rate of inflation in September. 


Electric Cars and Driving Range: Here’s What to Know

Many people considering an electric vehicle are turned off by their prices or the paucity of public charging stations. But the biggest roadblock often is “range anxiety”—the fear of getting stuck on a desolate road with a dead battery.

All EVs carry window stickers stating how far they should go on a full charge. Yet these range estimates—overseen by the Environmental Protection Agency and touted in carmakers’ ads—can be wrong in either direction: either overstating or understating the distance that can be driven, sometimes by 25% or more.

How can that be? Below are questions and answers about how driving ranges are calculated, what factors affect the range, and things EV owners can do to go farther on a charge.

How far will an electric vehicle go on a full battery?

The distance, according to EPA testing, ranges from 516 miles for the 2023 Lucid Air Grand Touring with 19-inch wheels to 100 miles for the 2023 Mazda MX-30.

Most EVs are in the 200-to-300-mile range. While that is less than the distance that many gasoline-engine cars can go on a full tank, it makes them suitable for most people’s daily driving and medium-size trips. Yet it can complicate longer journeys, especially since public chargers can be far apart, occupied or out of service. Plus, it takes many times longer to charge an EV than to fill a tank with gas.

How accurate are the EPA range estimates?

Testing by Car and Driver magazine found that few vehicles go as far as the EPA stickers say. On average, the distance was 12.5% shorter, according to the peer-reviewed study distributed by SAE International, formerly the Society of Automotive Engineers.

In some cases, the estimates were further off: The driving range of Teslas fell below their EPA estimate by 26% on average, the greatest shortfall of any EV brand the magazine tested. Separately, federal prosecutors have sought information about the driving range of Teslas, The Wall Street Journal reported. Tesla didn’t respond to a request for comment.

The study also said Ford’s F-150 Lightning pickup truck went 230 miles compared with the EPA’s 300-mile estimate, while the Chevrolet Bolt EV went 220 miles versus the EPA’s 259.

A GM spokesman said that “actual range may vary based on several factors, including things like temperature, terrain/road type, battery age, loading, use and maintenance.” Ford said in a statement that “the EPA [figure] is a standard. Real-world range is affected by many factors, including driving style, weather, temperature and if the battery has been preconditioned.”

Meanwhile, testing by the car-shopping site Edmunds found that most vehicles beat their EPA estimates. It said the Ford Lightning went 332 miles on a charge, while the Chevy Bolt went 265 miles.

That is confusing. How can the test results vary so much?

Driving range depends largely on the mixture of highway and city roads used for testing. Unlike gasoline-powered cars, EVs are more efficient in stop-and-go driving because slowing down recharges their batteries through a process called regenerative braking. Conversely, traveling at a high speed can eat up a battery’s power faster, while many gas-engine cars meet or exceed their EPA highway miles-per-gallon figure.

What types of driving situations do the various tests use?

Car and Driver uses only highway driving to see how far an EV will go at a steady 75 mph before running out of juice. Edmunds uses a mix of 60% city driving and 40% highway. The EPA test, performed on a treadmill, simulates a mixture of 55% highway driving and 45% city streets.

What’s the reasoning behind the different testing methods?

Edmunds believes the high proportion of city driving it uses is more representative of typical EV owners, says Jonathan Elfalan, Edmunds’s director of vehicle testing. “Most of the driving [in an EV] isn’t going to be road-tripping but driving around town,” he says.

Car and Driver, conversely, says its all-highway testing is deliberately more taxing than the EPA method. High-speed interstate driving “really isn’t covered by the EPA’s methodology,” says Dave VanderWerp, the magazine’s testing director. “Even for people driving modest highway commutes, we think they’d want to know that their car could get 20%-30% less range than stated on the window sticker.”

What does the EPA say about the accuracy of its range figures?

The agency declined to make a representative available to comment, but said in a statement: “Just like there are variations in EPA’s fuel-economy label [for gas-engine cars] and people’s actual experience on the road for a given make and model of cars/SUVs, BEV [battery electric vehicle] range can exceed or fall short of the label value.”

What should an EV shopper do with these contradictory range estimates?

Pick the one based on the testing method that you think matches how you generally will drive, highway versus city. When shopping for a car, be sure to compare apples to apples—don’t, for instance, compare the EPA range estimate for one vehicle with the Edmunds one for another. And view all these figures with skepticism. The estimates are just that.

Since range is so important to many EV buyers, why don’t carmakers simply add more batteries to provide greater driving distance?

Batteries are heavy and are the most expensive component in an EV, making up some 30% of the overall vehicle cost. Adding more could cut into a vehicle’s profit margin while the added weight means yet more battery power would be used to move the car.

But battery costs have declined over the past 10 years and are expected to continue to fall, while new battery technologies likely will increase their storage capacity. Already, some of the newest EV models can store more power at similar sticker prices to older ones.

What can an EV owner do to increase driving range?

The easiest thing is to slow down. High speeds eat up battery life faster. Traveling at 80 miles an hour instead of 65 can cut the driving range by 17%, according to testing by Geotab, a Canadian transportation-data company. And though a primal appeal of EVs is their zippy takeoff, hard acceleration depletes a battery much quicker than gentle acceleration.

Does cold weather lower the driving range?

It does, and sometimes by a great amount. The batteries are used to heat the car’s interior—there is no engine creating heat as a byproduct as in a gasoline car. And many EVs also use electricity to heat the batteries themselves, since cold can deteriorate the chemical reaction that produces power.

Testing by Consumer Reports found that driving in 15- to-20-degrees Fahrenheit weather at 70 mph can reduce range by about 25% compared to similar-speed driving in 65 degrees.

A series of short cold-weather trips degraded the range even more. Consumer Reports drove two EVs 40 miles each in 20-degree air, then cooled them off before starting again on another 40-mile drive. The cold car interiors were warmed by the heater at the start of each of three such drives. The result: range dropped by about 50%.

Does air conditioning degrade range?

Testing by Consumer Reports and others has found that using the AC has a much lower impact on battery range than cold weather, though that effect seems to increase in heat above 85 degrees.

I don’t want to freeze or bake in my car to get more mileage. What can I do?

“Precondition” your EV before driving off, says Alex Knizek, manager of automotive testing and insights at Consumer Reports. In other words, chill or heat it while it is still plugged in to a charger at home or work rather than using battery power on the road to do so. In the winter, turn on the seat heaters, which many EVs have, so you be comfortable even if you keep the cabin temperature lower. In the summer, try to park in the shade.

What about the impact from driving in a mountainous area?

Going up hills takes more power, so yes, it drains the battery faster, though EVs have an advantage over gas vehicles in that braking on the downside of hills returns juice to the batteries with regenerative braking.

Are there other factors that can affect range?

Tires play a role. Beefy all-terrain tires can eat up more electricity than standard ones, as can larger-diameter ones. And underinflated tires create more rolling resistance, and so help drain the batteries.

Most EVs give the remaining driving range on a dashboard screen. Are these projections accurate?

The meters are supposed to take into account your speed, outside temperature and other factors to keep you apprised in real time of how much farther you can travel. But EV owners and car-magazine testers complain that these “distance to empty” gauges can suddenly drop precipitously if you go from urban driving to a high-speed highway, or enter mountainous territory.

So be careful about overly relying on these gauges and take advantage of opportunities to top off your battery during a multihour trip. These stops could be as short as 10 or 15 minutes during a bathroom or coffee break, if you can find a high-powered DC charger.

Before embarking on a long trip, what should an EV owner do?

Fully charge the car at home before departing. This sounds obvious but can be controversial, since many experts say that routinely charging past 80% of a battery’s capacity can shorten its life. But they also say that charging to 100% occasionally won’t do damage. Moreover, plan your charging stops in advance to ease the I-might-run-out panic.

So battery life is an issue with EVs, just as with smartphones?

Yes, an EV battery’s ability to fully charge will degrade with use and age, likely leading to shorter driving range. Living in a hot area also plays a role. The federal government requires an eight-year/100,000-mile warranty on EV batteries for serious failure, while some EV makers go further and cover degradation of charging capacity. Replacing a bad battery costs many thousands of dollars.

What tools are available to map out charging stations?

Your EV likely provides software on the navigation screen as well as a phone app that show charging stations. Google and Apple maps provide a similar service, as do apps and websites of charging-station networks.

But always have a backup stop in mind—you might arrive at a charging station and find that cars are lined up waiting or that some of the chargers are broken. Damaged or dysfunctional chargers have been a continuing issue for the industry.

Any more tips?

Be sure to carry a portable charger with you—as a last resort you could plug it into any 120-volt outlet to get a dribble of juice.

Why Is Everyone So Unhappy at Work Right Now?

Americans, by many measures, are unhappier at work than they have been in years.

Despite wage increases, more paid time off and greater control over where they work, the number of U.S. workers who say they are angry, stressed and disengaged is climbing, according to Gallup’s 2023 workplace report. Meanwhile, a BambooHR analysis of data from more than 57,000 workers shows job-satisfaction scores have fallen to their lowest point since early 2020, after a 10% drop this year alone.

In interviews with workers around the country, it is clear the unhappiness is part of a rethinking of work life that began in 2020. The sources of workers’ discontent range from inflation, which is erasing much of recent pay gains, to the still-unsettled nature of the workday. People chafe against being micromanaged back to offices, yet they also find isolating aspects of hybrid and remote work. A cooling job market—especially in white-collar roles—is leaving many professionals feeling stuck.

Companies have largely moved on from pandemic operating mode, cutting costs and renewing a focus on productivity. The disconnect with workers has managers frustrated, and no quick fix seems to be at hand. Those in charge said they have given staff more money, flexibility and support, only to come up short.

The experiences of workers like Lindsey Leesmann suggest how expectations have shifted from just a few years ago. Leesmann, 38 years old, said she soured on a philanthropy job after having to return to the office two days a week earlier this year.

Prepandemic, she would have been happy working three days a week at home. “It would have been a dream come true.” Still, her team’s in-office requirements seemed like going backward, and made her feel that her professionalism and work quality were in doubt. Instead of collaborating more, she and others rarely left their desks, except for meetings or lunch, she said. Negative feelings followed her home on her hourlong commute, leaving her short-tempered with her kids.

“You try to keep work and home separate, but that sort of stuff is just impacting your mental health so much,” said Leesmann, who recently moved to a new job that requires five in-office days a month.

No more honeymoon

The discontent has business leaders struggling for answers, said Stephan Scholl, chief executive of Alight Solutions, a technology company focused on benefits and payroll administration. Many of the Fortune 100 companies on Alight’s client list boosted spending on employee benefits such as mental health, child care and well-being bonuses by 20% over the pandemic years.

“All that extra spend has not translated into happier employees,” Scholl said. In an Alight survey of 2,000 U.S. employees this year, 34% said they often dread starting their workday—an 11-percentage-point rise since 2020. Corporate clients have told him mental-health claims and costs from employee turnover are rising.

One factor is the share of workers who are relatively new to their roles after record levels of job-switching, said Benjamin Granger, chief workplace psychologist at software company Qualtrics. Many employers have focused more on hiring than situating new employees well, leaving many newbies feeling adrift. In other cases, workers discovered shiny-seeming new jobs weren’t a great fit.

The upshot is that the newest workers are among the least satisfied, Qualtrics data show—a reversal of the higher levels of enthusiasm that fresh hires typically voice. In its study of nearly 37,000 workers published last month, people less than six months into a job reported lower levels of engagement, feelings of inclusion and intent to stay than longer-tenured workers. They also scored lower on those metrics than new workers in 2022, suggesting the pay raises that lured many people to new jobs might not be as satisfying as they were a year or two ago.

“What happened to that honeymoon phase?” Granger said.

John Shurr, a 66-year-old former manufacturing engineer, took a job as an inventory manager at a heavy-equipment retailer in the spring in Missoula, Mont., after being laid off during the pandemic.

“It was a nice job title on a pretty rotten job,” said Shurr, who learned soon after starting that his duties would also include sales to walk-in customers.

When Shurr broached the subject, his boss asked him to give it a chance and said he was really needed on the showroom floor. Shurr, who describes himself as more of a computer guy, quit about a month later.

“I feel kind of trapped at the moment,” said Shurr, who has since taken a part-time job as a parts manager as he tries to find full-time work.

Bridging the distance

Long-distance relationships between bosses and staff might also be an issue. Nearly a third of workers at large firms don’t work in the same metro area as their managers, up from about 23% in February 2020, according to data from payroll provider ADP.

Distance has weakened ties among co-workers and heightened conflict, said Moshe Cohen, a mediator and negotiation coach who teaches conflict resolution at Boston University’s Questrom School of Business. He has noticed more employees calling co-workers or bosses toxic or impossible, signs that trust is thin.

Cohen’s corporate clients said their employees are increasingly transactional with one another. Some are coaching workers in the finer points of dialogue, such as saying hello first before jumping into the substance of a conversation.

“The idea of slowing down, taking the time, being genuine, trying to actually establish some sort of connection with the other person—that’s really missing,” Cohen said.

One Los Angeles-based consultant in his 20s, who asked to remain anonymous because he is seeking another job, said that when he started his job at a large company last year, his largely remote colleagues were focused on their own work, unwilling to show a new hire the ropes or invite him for coffee. Many leave cameras off for video calls and few people show up at the office, making it hard to build relationships.

“There’s zero humanity,” he said, noting that he is seeking another job with a strong office culture.

The share of U.S. companies mandating office attendance five days a week has fallen this year—to 38% in October from 49% at the start of the year—according to Scoop Technologies, a software firm that developed an index to monitor workplace policies of nearly 4,500 companies.

Some companies have reversed flexible remote-work policies—in large part, they said, to boost employee engagement and productivity—only to face worker backlash.

Not all the data point downward. A Conference Board survey in November 2022 of U.S. adults showed workers were more satisfied with their jobs than they had been in years. Key contingents among the happiest employees: people who voluntarily switched roles during the pandemic and those working a mix of in-person and remote days. But that poll was taken before a spate of layoffs at high-profile companies and big declines in the number of knowledge-worker and professional jobs advertised.

At Farmers Group, workers posted thousands of mostly negative comments on the insurer’s internal social-media platform after its new CEO nixed the company’s previous policy allowing most workers to be remote.

Employees like Kandy Mimande said they felt betrayed. “We couldn’t get the ‘why,’” said the 43-year-old, who had sold her car and spent thousands of dollars to redo her home office under the remote-work policy. She shelled out $10,000 for a used car for the commute. A company spokesperson said that not all employees will support every business decision and that Farmers hasn’t seen a significant impact on staff retention.

During a brief leave, Mimande realised she no longer felt a sense of purpose from her product-management job. She resigned last month after she and her wife decided they could live on one salary.

She now helps promote a band and pet-sits. “It’s so much easier for me to report to myself,” she said.

Greener Homes, Living Alone And Ongoing Rate Pain

Ray White’s chief economist, Nerida Conisbee says property price growth will continue next year and mortgage holders will need to “survive until 2025” amid expectations of higher interest rates for longer.

Ms Conisbee said strong population growth and a housing supply shortage combatted the impact of rising interest rates in 2023, leading to unusually strong price growth during a rate hiking cycle. The latest CoreLogic data shows home values have increased by more than 10 percent in the year to date in Sydney, Brisbane and Perth. Among the regional markets, price growth has been strongest in regional South Australia with 8.6 percent growth and regional Queensland at 6.9 percent growth.

“As interest rates head close to peak, it is expected that price growth will continue. At this point, housing supply remains extremely low and many people that would be new home buyers are being pushed into the established market,” Ms Conisbee said. “Big jumps in rents are pushing more first home buyers into the market and population growth is continuing to be strong.”

Ms Conisbee said interest rates will be higher for longer due to sticky inflation. “… we are unlikely to see a rate cut until late 2024 or early 2025. This means mortgage holders need to survive until 2025, paying far more on their home loans than they did two years ago.”

Buyers in coastal areas currently have a window of opportunity to take advantage of softer prices, Ms Conisbee said. “Look out for beach house bargains over summer but you need to move quick. In many beachside holiday destinations, we saw a sharp rise in properties for sale and a corresponding fall in prices. This was driven by many pandemic driven holiday home purchases coming back on to the market.”

3 key housing market trends for 2024

Here are three of Ms Conisbee’s predictions for the key housing market trends of 2024.

Luxury apartment market to soar

Ms Conisbee said the types of apartments being built have changed dramatically amid more people choosing to live in apartments longer-term and Australia’s ageing population downsizing. “Demand is increasing for much larger, higher quality, more expensive developments. This has resulted in the most expensive apartments in Australia seeing price increases more than double those of an average priced apartment. This year, fewer apartments being built, growing population and a desire to live in some of Australia’s most sought-after inner urban areas will lead to a boom in luxury apartment demand.”

Homes to become even greener

The rising costs of energy and the health impacts of heat are two new factors driving interest in green homes, Ms Conisbee said. “Having a greener home utilising solar and batteries makes it cheaper to run air conditioning, heaters and pool pumps. We are heading into a particularly hot summer and having homes that are difficult to cool down makes them far more dangerous for the elderly and very young.”

More people living alone

For some time now, long-term social changes such as delayed marriage and an ageing population have led to more people living alone. However, Ms Conisbee points out that the pandemic also showed that many people prefer to live alone for lifestyle reasons. “Shorter term, the pandemic has shown that given the chance, many people prefer to live alone with a record increase in single-person households during the time. This trend may influence housing preferences, with a potential rise in demand for smaller dwellings and properties catering to individuals rather than traditional family units.”

China Tried Using Economic Ties to Bring Taiwan Closer. It Isn’t Working.

TAIPEI—For years, Beijing hoped to win control of Taiwan by convincing its people their economic futures were inextricably tied to China.

Instead, more Taiwanese businesses are pivoting to the U.S. and other markets, reducing the island democracy’s dependence on China and angering Beijing as it sees its economic leverage over Taiwan ebb.

In one sign of the shift, the U.S. replaced mainland China as the top buyer of Taiwanese agricultural products for the first time last year.

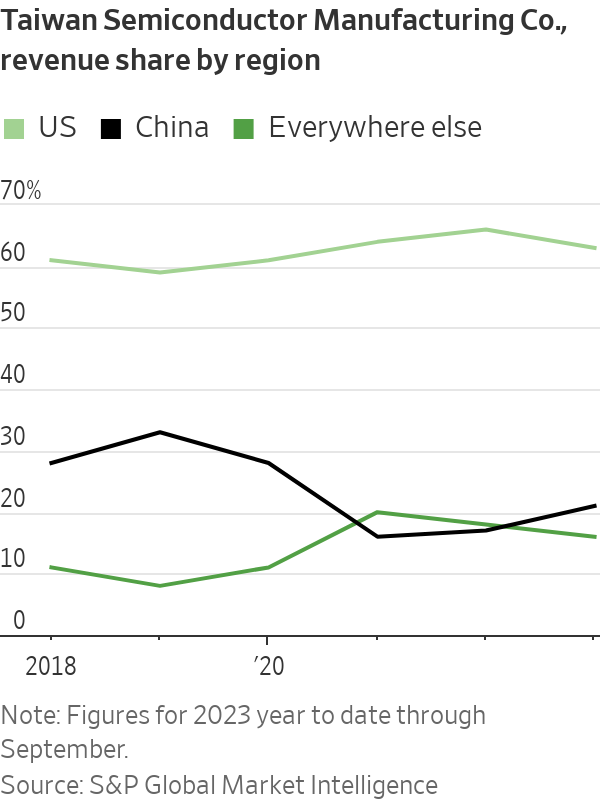
Electronics firms such as chip maker Taiwan Semiconductor Manufacturing Co. are also selling more goods to American and other non-Chinese buyers, thanks in part to Washington’s chip restrictions and Apple’s bets on Taiwanese chips.

Overall, Taiwanese exports to the U.S. in the first 10 months of 2023 were more than 80% higher than in the same period of 2018, Taiwanese government data shows. Taiwanese exports to the mainland were 1% lower—a major change from a decade or so ago when China’s and Taiwan’s economies were rapidly integrating.

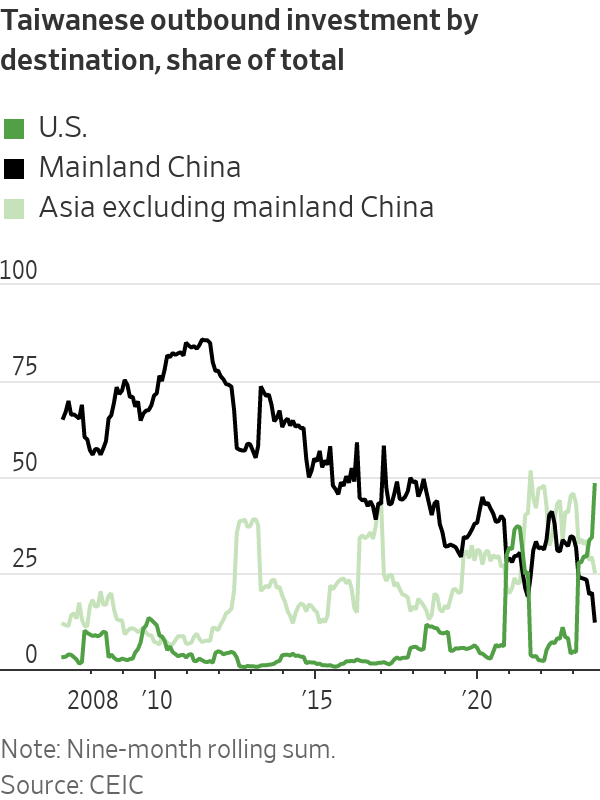
Taiwan’s outbound investment has also shifted. After flowing mostly to mainland China in the early 2000s, it has now moved decisively toward other destinations, including Southeast Asia, India and the U.S.

Taiwanese electronics giant Foxconn, which assembles iPhones in mainland China, is expanding in India and Vietnam after Apple began pushing its suppliers to diversify.

Chinese state media recently reported that China had opened tax and land-use probes into Foxconn. Though Taiwanese officials and analysts interpreted the probes as a sign that China wants Foxconn founder Terry Gou to drop plans to run in Taiwan’s presidential election in January, some have said Beijing may also be trying to pressure Foxconn into resisting decoupling with China.

“Any attempt to ‘talk down’ the mainland’s economy or to seek ‘decoupling’ is driven by ulterior motives and will be futile,” said a spokeswoman for Beijing’s Taiwan Affairs Office in September. “The mainland is always the best choice for Taiwanese compatriots and businesses.”

Fully decoupling from mainland China’s economy likely isn’t possible, and would be disastrous for Taiwan, not to mention China, even if it were.

Foxconn and other major Taiwanese companies depend heavily on China for parts, testing and buyers. Some 25% of Taiwan’s electronic-parts imports still come from the mainland.

If China’s weakened economy returns to strong growth, it could shift the calculus back in favor of the mainland, where the Communist Party claims Taiwan despite never having ruled it. About 21% of Taiwan’s total goods trade this year has been with mainland China, versus 14% for the U.S., though the U.S. share has risen from 11% in 2018.

“My hunch is that the large manufacturing sectors will try to stay in the Chinese market, even with harsh conditions,” said Alexander Huang, director of the international affairs department of the opposition Kuomintang Party, whose supporters include business people with mainland ties. “If you talk to those business owners, they say, ‘Nah, no way will I give it to my competitors.’”

Even so, many forces are pushing Taiwan to rewire its economic relationship with China.

Trump-era tariffs and Biden administration export controls have raised the cost of sourcing from China, and in some cases prohibited it. U.S. firms are pushing their Taiwanese suppliers to diversify sourcing, and rising wages in China have made it less attractive than before.

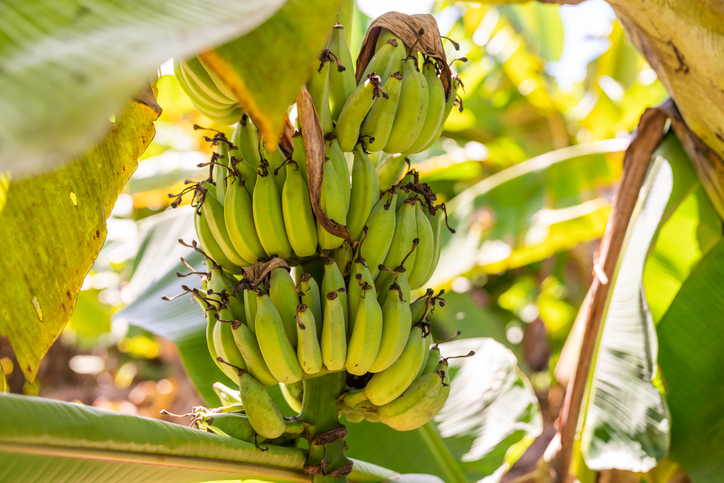
Long-running shifts in Taiwanese sentiment toward China—and China’s own efforts to punish the island using its economic leverage—are also factors. China has banned Taiwanese agricultural products such as pineapple and, in 2022, grouper fish, and restricted outbound tourism to Taiwan.

Those restrictions to some degree have backfired, pushing Taiwanese businesses to look elsewhere.

Casting for new markets

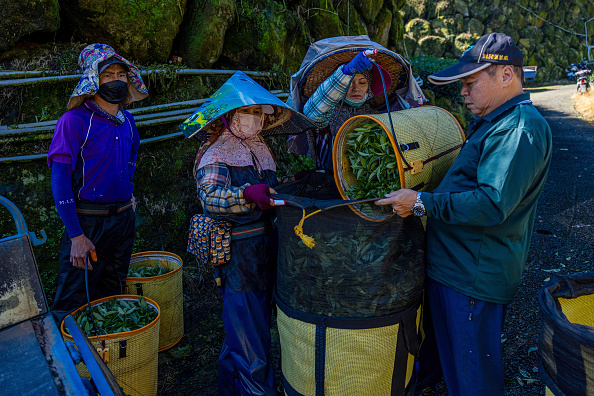
Chang Chia-sheng, who runs a fish farming operation in Taiwan, said his main export target a decade ago was mainland China. But as geopolitical tensions climbed, he looked elsewhere. Sales to Americans have jumped fivefold since 2018, he said. “In the U.S., things just seem to work out more easily,” Chang said.

The U.S. and Taiwan reached an agreement in May on a number of trade and investment measures to deepen ties, though the deal stopped short of reducing tariffs.

In the June quarter of 2023, 63% of revenue at TSMC, which makes most of the world’s most cutting-edge logic chips, came from the U.S., up from 54% in the same period in 2018, according to S&P Global data. Just 12% of TSMC’s revenue now comes from Chinese buyers, down from 22% in the second quarter of 2018.

Taiwan’s government is also encouraging closer economic links with Southeast Asia, South Asia, Australia and New Zealand. Its “New Southbound Policy,” rolled out in 2016, has been the subject of fierce debate in Taiwan, with the Kuomintang Party saying steps to boost relations—like handing out scholarships—aren’t worth the cost.

Exports to “New Southbound” partners have risen, however, to $66 billion in the first nine months of 2023, about 50% higher than the same period in 2016.

“Frankly speaking, we’re responding reactively” to the need for more diverse trading partners, Taiwan’s Economic Minister Wang Mei-hua said. “Taiwan needs to manage the risks on its own, but we also need our allies to join us more in mitigating these risks.”

Together, the U.S. and the six largest Southeast Asian economies accounted for 36% of Taiwanese exports in the third quarter of 2023, according to data from CEIC, surpassing the percentage sent to mainland China and Hong Kong on a quarterly basis for the first time since 2002.

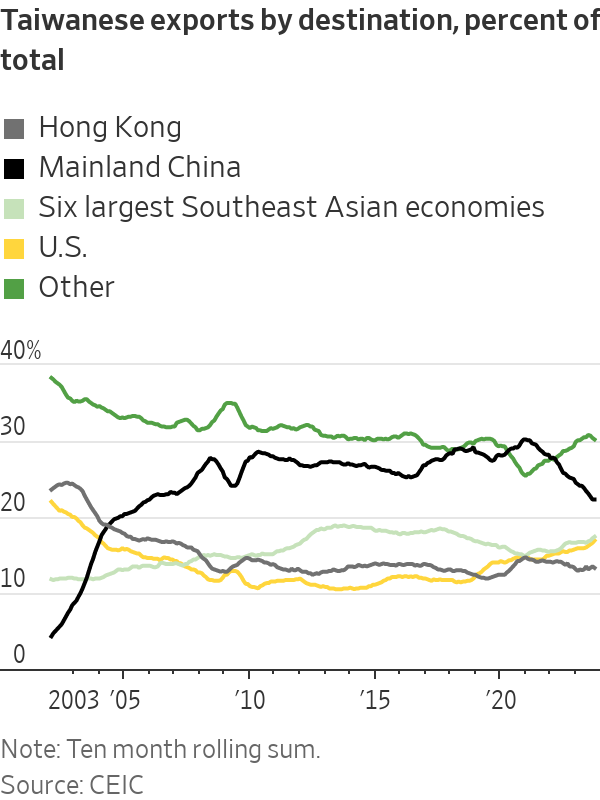
In September, Taiwan sent less than 21% of its exports to the mainland, the lowest percentage since the global financial crisis.

Taiwanese foreign investment into mainland China, steady at around $10 billion a year for most of the early 2010s, plummeted in late 2018 and has since been running at about half that level, according to Taiwanese government data. In 2023 so far, just 13% of Taiwan’s investment went to mainland China; 25% went to other Asian locations, and nearly half went to the U.S.

A survey of Taiwanese businesses conducted last year on behalf of the Center for Strategic and International Studies, a Washington think tank, found that nearly 60% had moved or were considering moving some production or sourcing out of China—a significantly higher rate than European or American firms.

Jay Yen, chief executive of Yen and Brothers, a Taiwanese frozen-food processing company, said his firm received a government subsidy of around $75,000 to market his products to American consumers. China now only accounts for about 3% of its revenue, he said.

That said, “if you really have to consider the risks of a war between the U.S. and China and its potential impact on Taiwan, you might want to place your bets on a third country—neither China nor the U.S.,” Yen added.

Reversing the tide

After China began to open up its economy in the late 1970s, Taiwanese businesses were among the first investors.

By the 2000s, China seemed to be succeeding in its strategy of integrating the two economies, with more than 28% of Taiwan’s exports going to the mainland in 2010, from less than 4% a decade earlier.

Direct flights between the two sides were normalised for the first time in decades. Mainland tourists were allowed to visit Taiwan on their own.

By 2014, the tide was turning as more Taiwanese grew worried about over dependence on China. Student demonstrators protested against a trade pact, later abandoned, that would have deepened ties with China. President Tsai Ing-wen, who took office in 2016, has pushed to diversify Taiwan’s economy.

China has responded by moving trade issues more into the spotlight.

In April, it opened an investigation into Taiwanese trade restrictions that it says limit exports of more than 2,400 items from the mainland to the island in violation of World Trade Organization rules. In October, China’s Ministry of Commerce announced the probe would be extended until Jan. 12—the day before Taiwan’s coming election.

Taiwan’s government has called the probe politically motivated.

Chinese officials have implied that Beijing could suspend preferential tariff rates for some Taiwanese goods in China under a 2010 deal signed when Kuomintang’s Ma Ying-jeou was president. Beijing has also reacted angrily to Taiwan’s recent trade agreement with the U.S.

For Taiwanese companies, building and operating new factories in places other than China isn’t cheap or easy. Protests have at times disrupted operations at Indian plants operated by Foxconn and Wistron, another Apple supplier. In September, a fire halted production at a Taiwanese facility in Tamil Nadu.

Still, some Taiwanese businesspeople have clearly soured on China.

“The electronics industry has already become a Chinese empire, not a Taiwanese one,” says Leo Chiu, who worked in mainland China in quality control for an electronics manufacturer for 14 years before concluding he couldn’t move up further there and returning to Taiwan in 2019. Many of his old colleagues have left, he said.

“If Xi Jinping steps down, there’s still a chance it could change,” says Chiu. “But I think it’s very hard.”

Why Stars Are Renting Out Their Homes for Dirt Cheap

Martha Stewart’s 150-plus-acre property in Bedford, N.Y., includes a farm with horse stables and a chicken coop, a fruit orchard, a peacock pen and seven stately houses.

One of the abodes opened for a night’s stay this month.

The domestic goddess is among the A-listers, including Gwyneth Paltrow and Mariah Carey, putting their estates or penthouses up for short-term stays on rental sites such as Airbnb and Booking.com for nominal fees or no cost at all.

“It is a very pleasant weekend in the country,” Stewart said in an interview.

Why would a celebrity invite strangers to traipse through their home? Rental companies can use the attention to reach new audiences and distract from public criticism over hassles such as rising fees. Luminaries can promote their own brands, and guests get to briefly live like a star, in a highly orchestrated way.

Stewart said she had never used Booking.com or Airbnb for her own travel, and was intrigued by what the experience would be like as the homeowner. She recently announced that one of her farmhouse’s residences—her “tenant house”—in Bedford, would be bookable for two guests for one night starting Nov. 18. The Thanksgiving-themed overnight (Thanksgiving is among her favourite holidays) included a guided tour of the farm, a wreath-making class and a brunch with Stewart herself.

In keeping with the holiday vibe, the getaway was priced at $11.23, as in Nov. 23, this year’s Thanksgiving date.

The two-bedroom cottage where her guests stayed is always prepared for visitors, she said. (Of course it is.) That meant she didn’t have to worry about removing personal items, and she was unfazed about opening her home to people she didn’t know.

But don’t expect to post all over Facebook about your stay at Martha’s. Booking.com said celebrities can ask their guests to sign nondisclosure agreements, something Stewart required for hers. What exactly it is like to spend a night in any of these VIP homes will likely remain rarefied knowledge.

Celebrities are compensated for the home stays; Leslie Cafferty, Booking.com’s chief communications officer, declined to disclose how much.

People have long had a voyeuristic fascination with the lifestyles of the rich and famous. In Los Angeles, companies compete to offer celebrity-home tours, where passengers crane to see mansions behind gates and humongous hedges while sitting in faraway buses. Dwellings with even a patina of historic relevance draw fans. “George Washington slept here!” says a title for one Virginia farmhouse on Airbnb. (Wrote one reviewer: “This is a beautiful old home with wonderfully scenic views. There are horses, donkeys, and the oddest assortment of charismatic dogs.”)

Some can even be enthralled to sleep in a dorm room—if it once housed American royalty-turned-U. S.-president. At Harvard University, visiting politicians and notable figures including actor Alec Baldwin have stayed overnight at John F. Kennedy’s senior-year dorm suite, though it hasn’t been available for personal use for several years.

Companies such as Airbnb have faced scrutiny over soaring cleaning fees and host demands. In September, New York City began cracking down on short-term rentals by requiring hosts to register with the city and meet multiple requirements, such as not renting out an entire property. During a recent travel-industry event, Airbnb’s CEO Brian Chesky acknowledged seeing thousands of complaints on social media about rising rental costs.

The inexpensive and publicity-drawing celebrity home stays are one of several ways short-term rental companies are marketing to new hosts and guests.

Earlier this year, Paltrow invited guests to spend the night at her Montecito, Calif., home free of charge through Airbnb. The sunny, white-marbled rental featured a bathroom filled with products from Goop, Paltrow’s lifestyle company, and activities such as transcendental meditation. Through Airbnb, Ashton Kutcher and Mila Kunis opened up their Santa Barbara beach house. The stars greeted their guests personally, and Kutcher documented part of their stay on his Instagram. Airbnb declined to comment.

Those who walk through the doors of a celebrity-anointed home might wonder: Should they expect to see family photos, or Paltrow’s personal trinkets hanging on the walls? And do they really get the run of the whole house?

That is up to the stars, Cafferty said. The entirety of Stewart’s guesthouse is available for the duration of the guests’ stay. Carey, the queen of Christmas, opened both her New York City penthouse and her rental home in Beverly Hills, Calif., to fans via Booking.com—yet Carey’s penthouse was only available for a cocktail hour; her guests stayed overnight at The Plaza Hotel.

Producer DJ Khaled opened only one room of his Miami house for Airbnb—his sneaker closet. To be fair, his sneaker closet doesn’t look like your sneaker closet. His is the size of a small dorm room, large enough for a bed for two, a shoeshine station and floor-to-ceiling sneakers (which guests weren’t allowed to touch). This was bookable last year for $11.

One of the guests who spent the night with DJ Khaled’s shoes wrote that the stay came with a free sneaker-shopping trip and chauffeurs, deeming it “an experience from start to finish.” No word on how the sneaker closet smelled, though the reviewer called it “immaculate.”

Sarah Jessica Parker invited two guests to her Hamptons home via Booking.com. It came with access to a crystal-blue private beach, a free pair of heels from Parker’s shoe line and reservations at some of her favorite local restaurants (though no appearance from Parker herself). Her rental went up for $19.98—priced for the year “Sex and the City” premiered.